
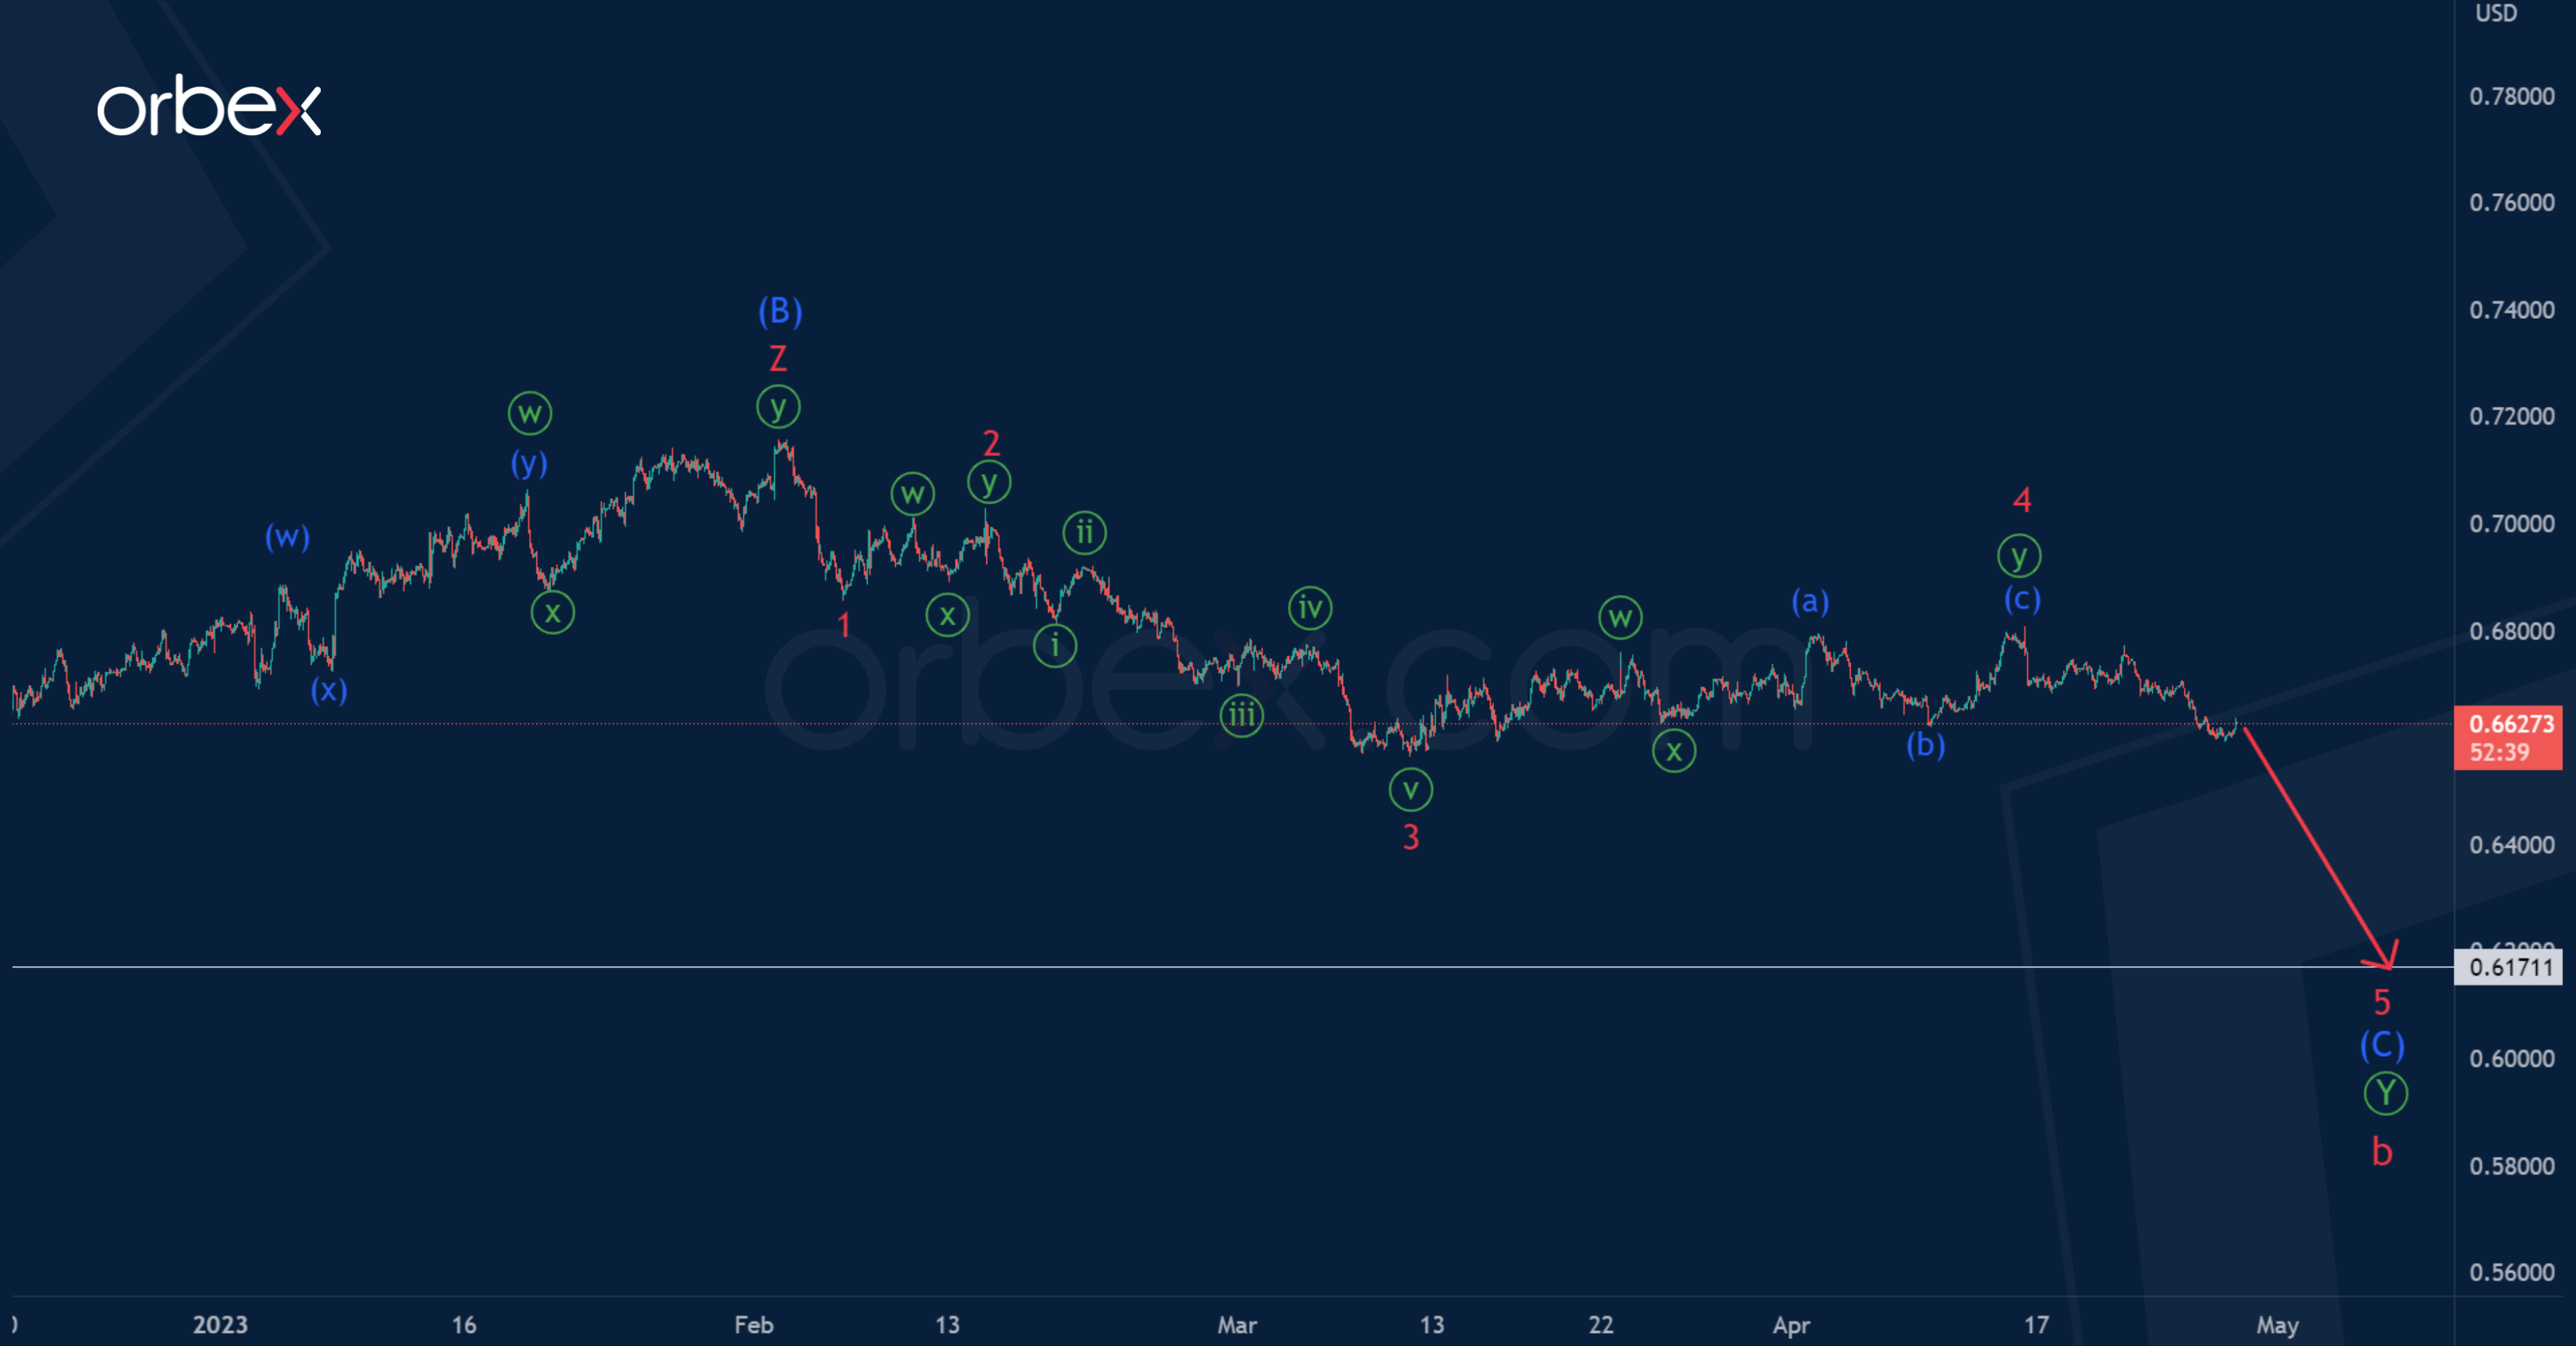
In the long term, AUDUSD seems to be forming a large cycle correction b. This correction has the structure of a primary double zigzag Ⓦ-Ⓧ-Ⓨ.
Inside the actionary wave Ⓨ, two parts can be completed, i.e., the impulse (A) and the intermediate correction (B) in the form of a triple zigzag W-X-Y-X-Z.
At the time of writing, an impulse (C) can be built, consisting of minor sub-waves 1-2-3-4-5.

There is a high probability that the impulse (C) will end at the minimum of 0.617, which was marked by the impulse wave (A).
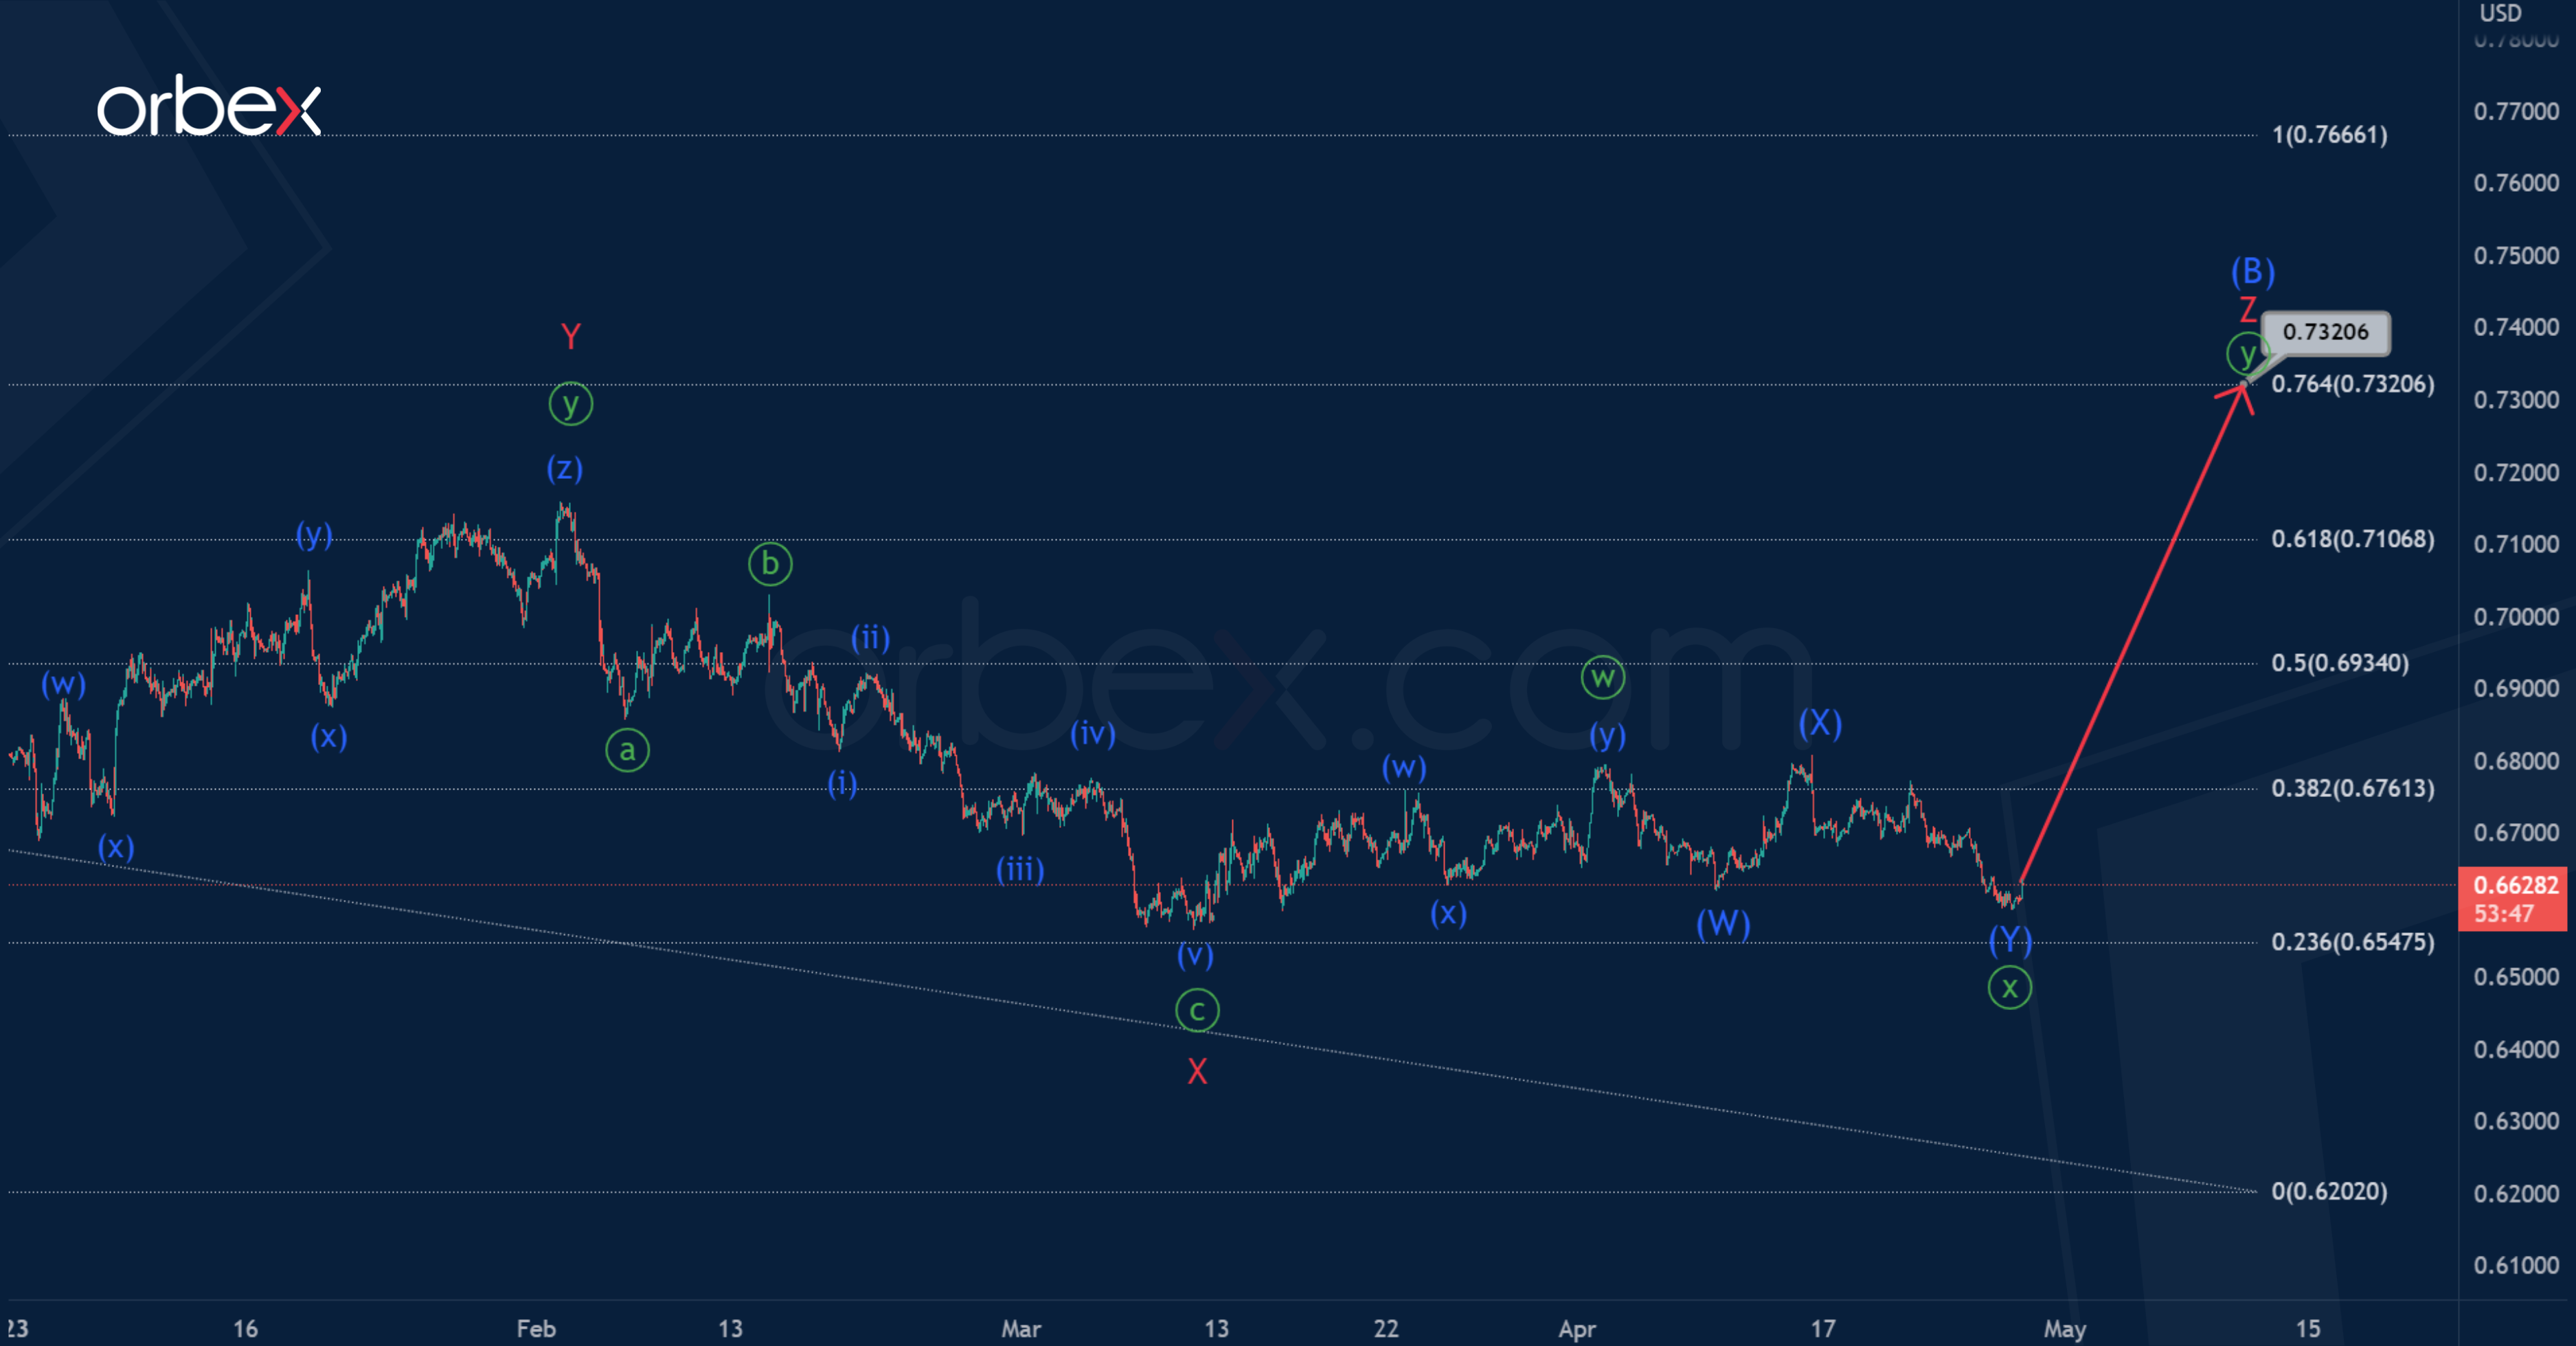
The alternative chart shows an incomplete intermediate correction (B).
The indicated correction (B) has a complex internal structure of the triple zigzag W-X-Y-X-Z, as in the first scenario, but its end is expected at a higher level.
It is assumed that in the last section we see the construction of a minor wave Z. This wave may end in the form of a minute double zigzag near 0.732.
At the level of 0.732, correction (B) will be at 76.4% of impulse (A).

![Credit Card 160×600 [EN]](https://assets.iorbex.com/blog/wp-content/uploads/2023/06/13144507/Blog-Banner_EN-Banner_160X600X2.webp)