
NZDUSD tests critical floor
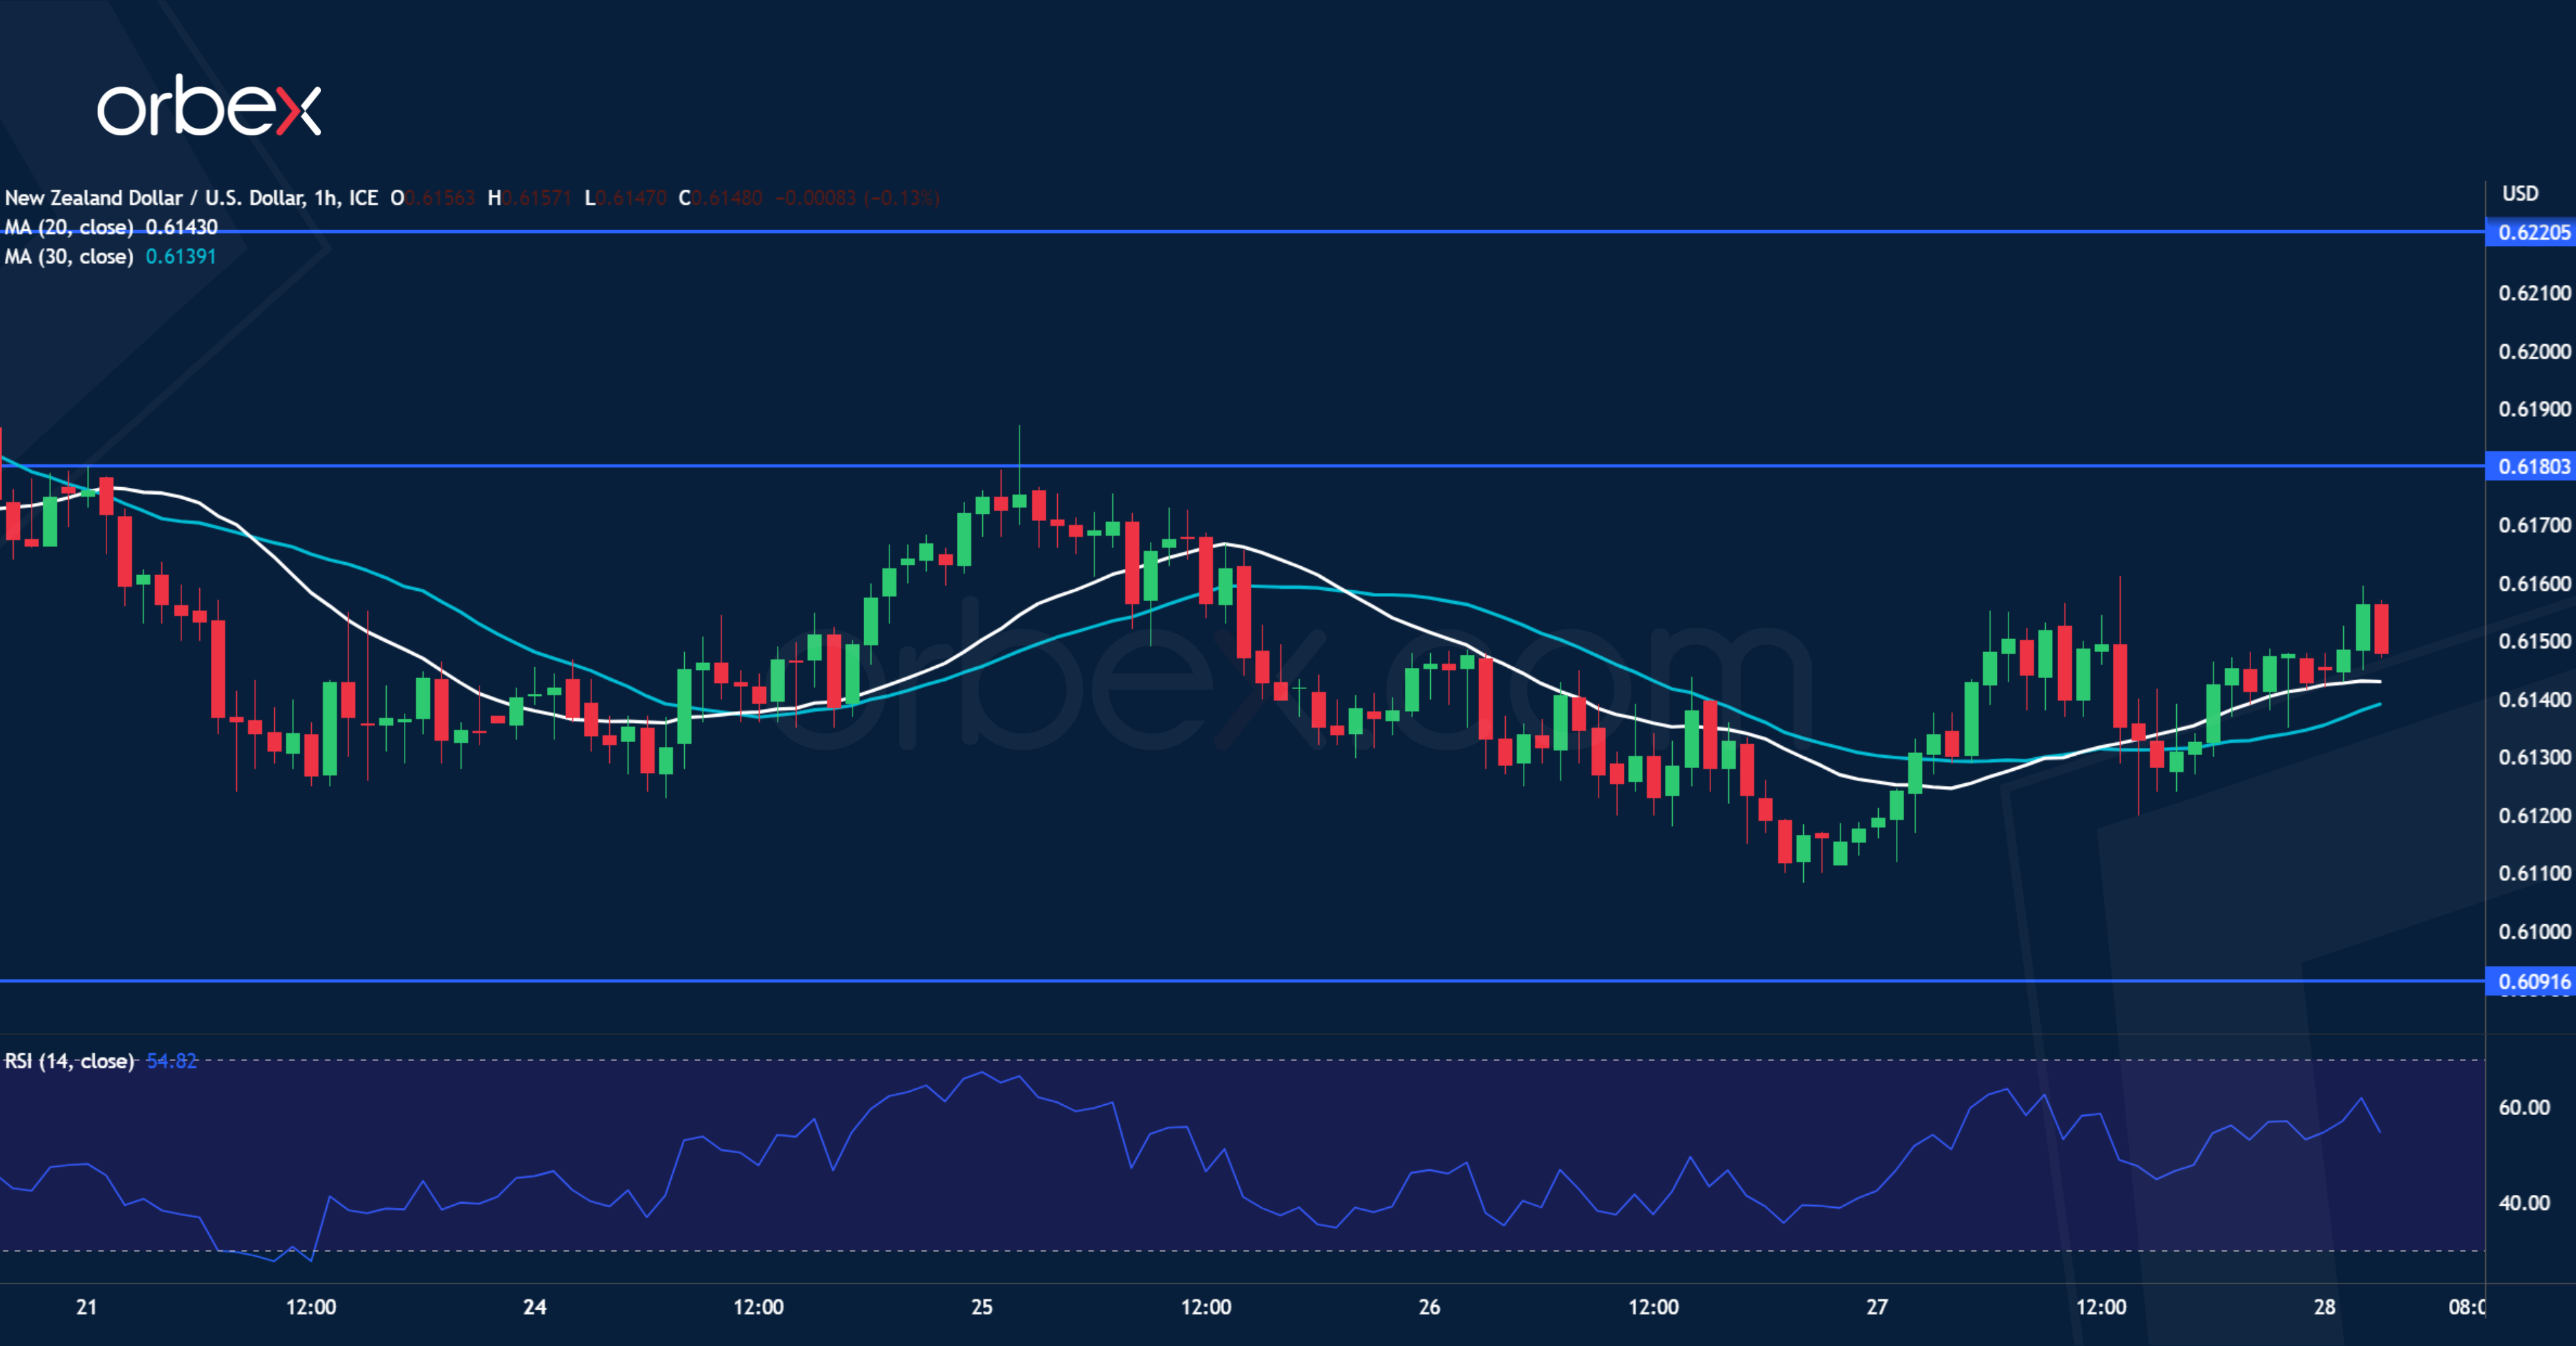
The US dollar advanced as the core PCE accelerated in Q1. The pair is hovering above the daily support of 0.6090 as kiwi buyers struggle to hold on to their gains. Rebounds have been capped so far which indicates a growing downward pressure. A bearish breakout would trigger a broader sell-off as trapped bulls scramble for the exit and lead to a correction below the psychological level of 0.6000. On the upside, 0.6180 is the first hurdle and only a close above the support-turned-resistance of 0.6220 would turn sentiment around.
EURJPY tests resistance

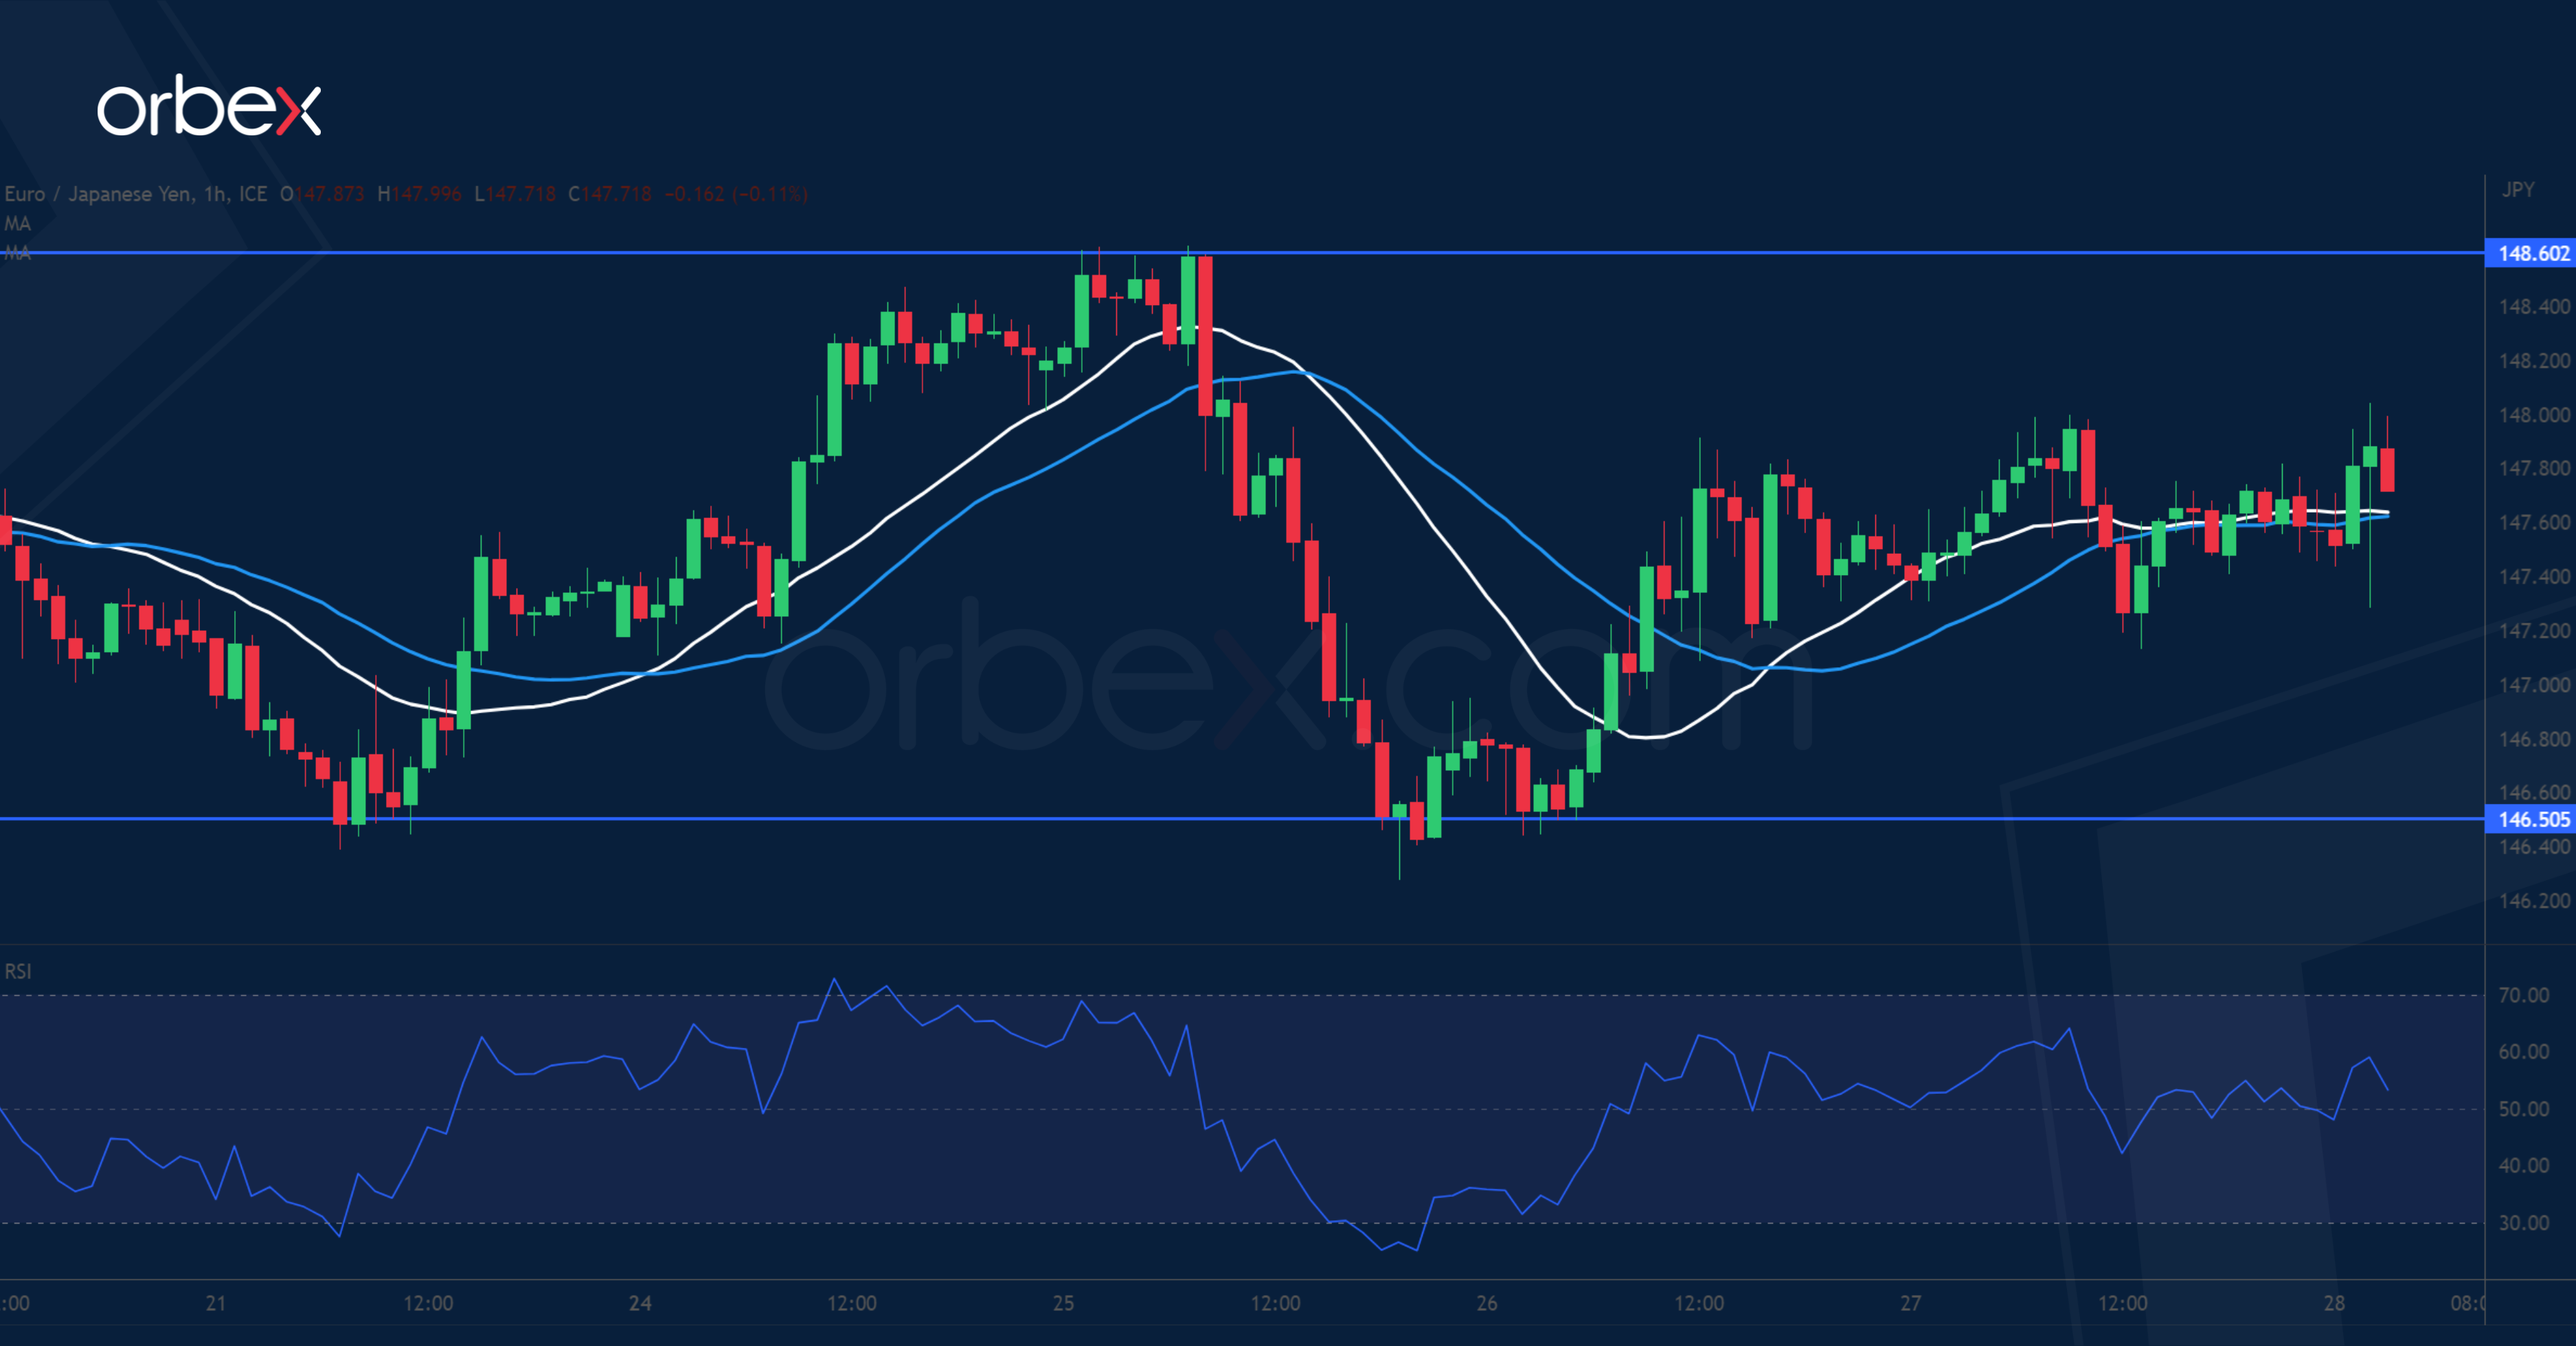
The Japanese yen recoups some losses as April’s CPI in the Tokyo area beat expectations. On the daily chart, the single currency is consolidating its gain after rising above October 2021’s high of 147.70. An attempt below 146.50 has shaken out some weaker hands but the overall upward direction remained intact. This level near the 20-day SMA is important in keeping the current bullish momentum going or a deeper retracement could be in order. A break above the recent peak at 148.60 would resume the uptrend.
NAS 100 breaks higher
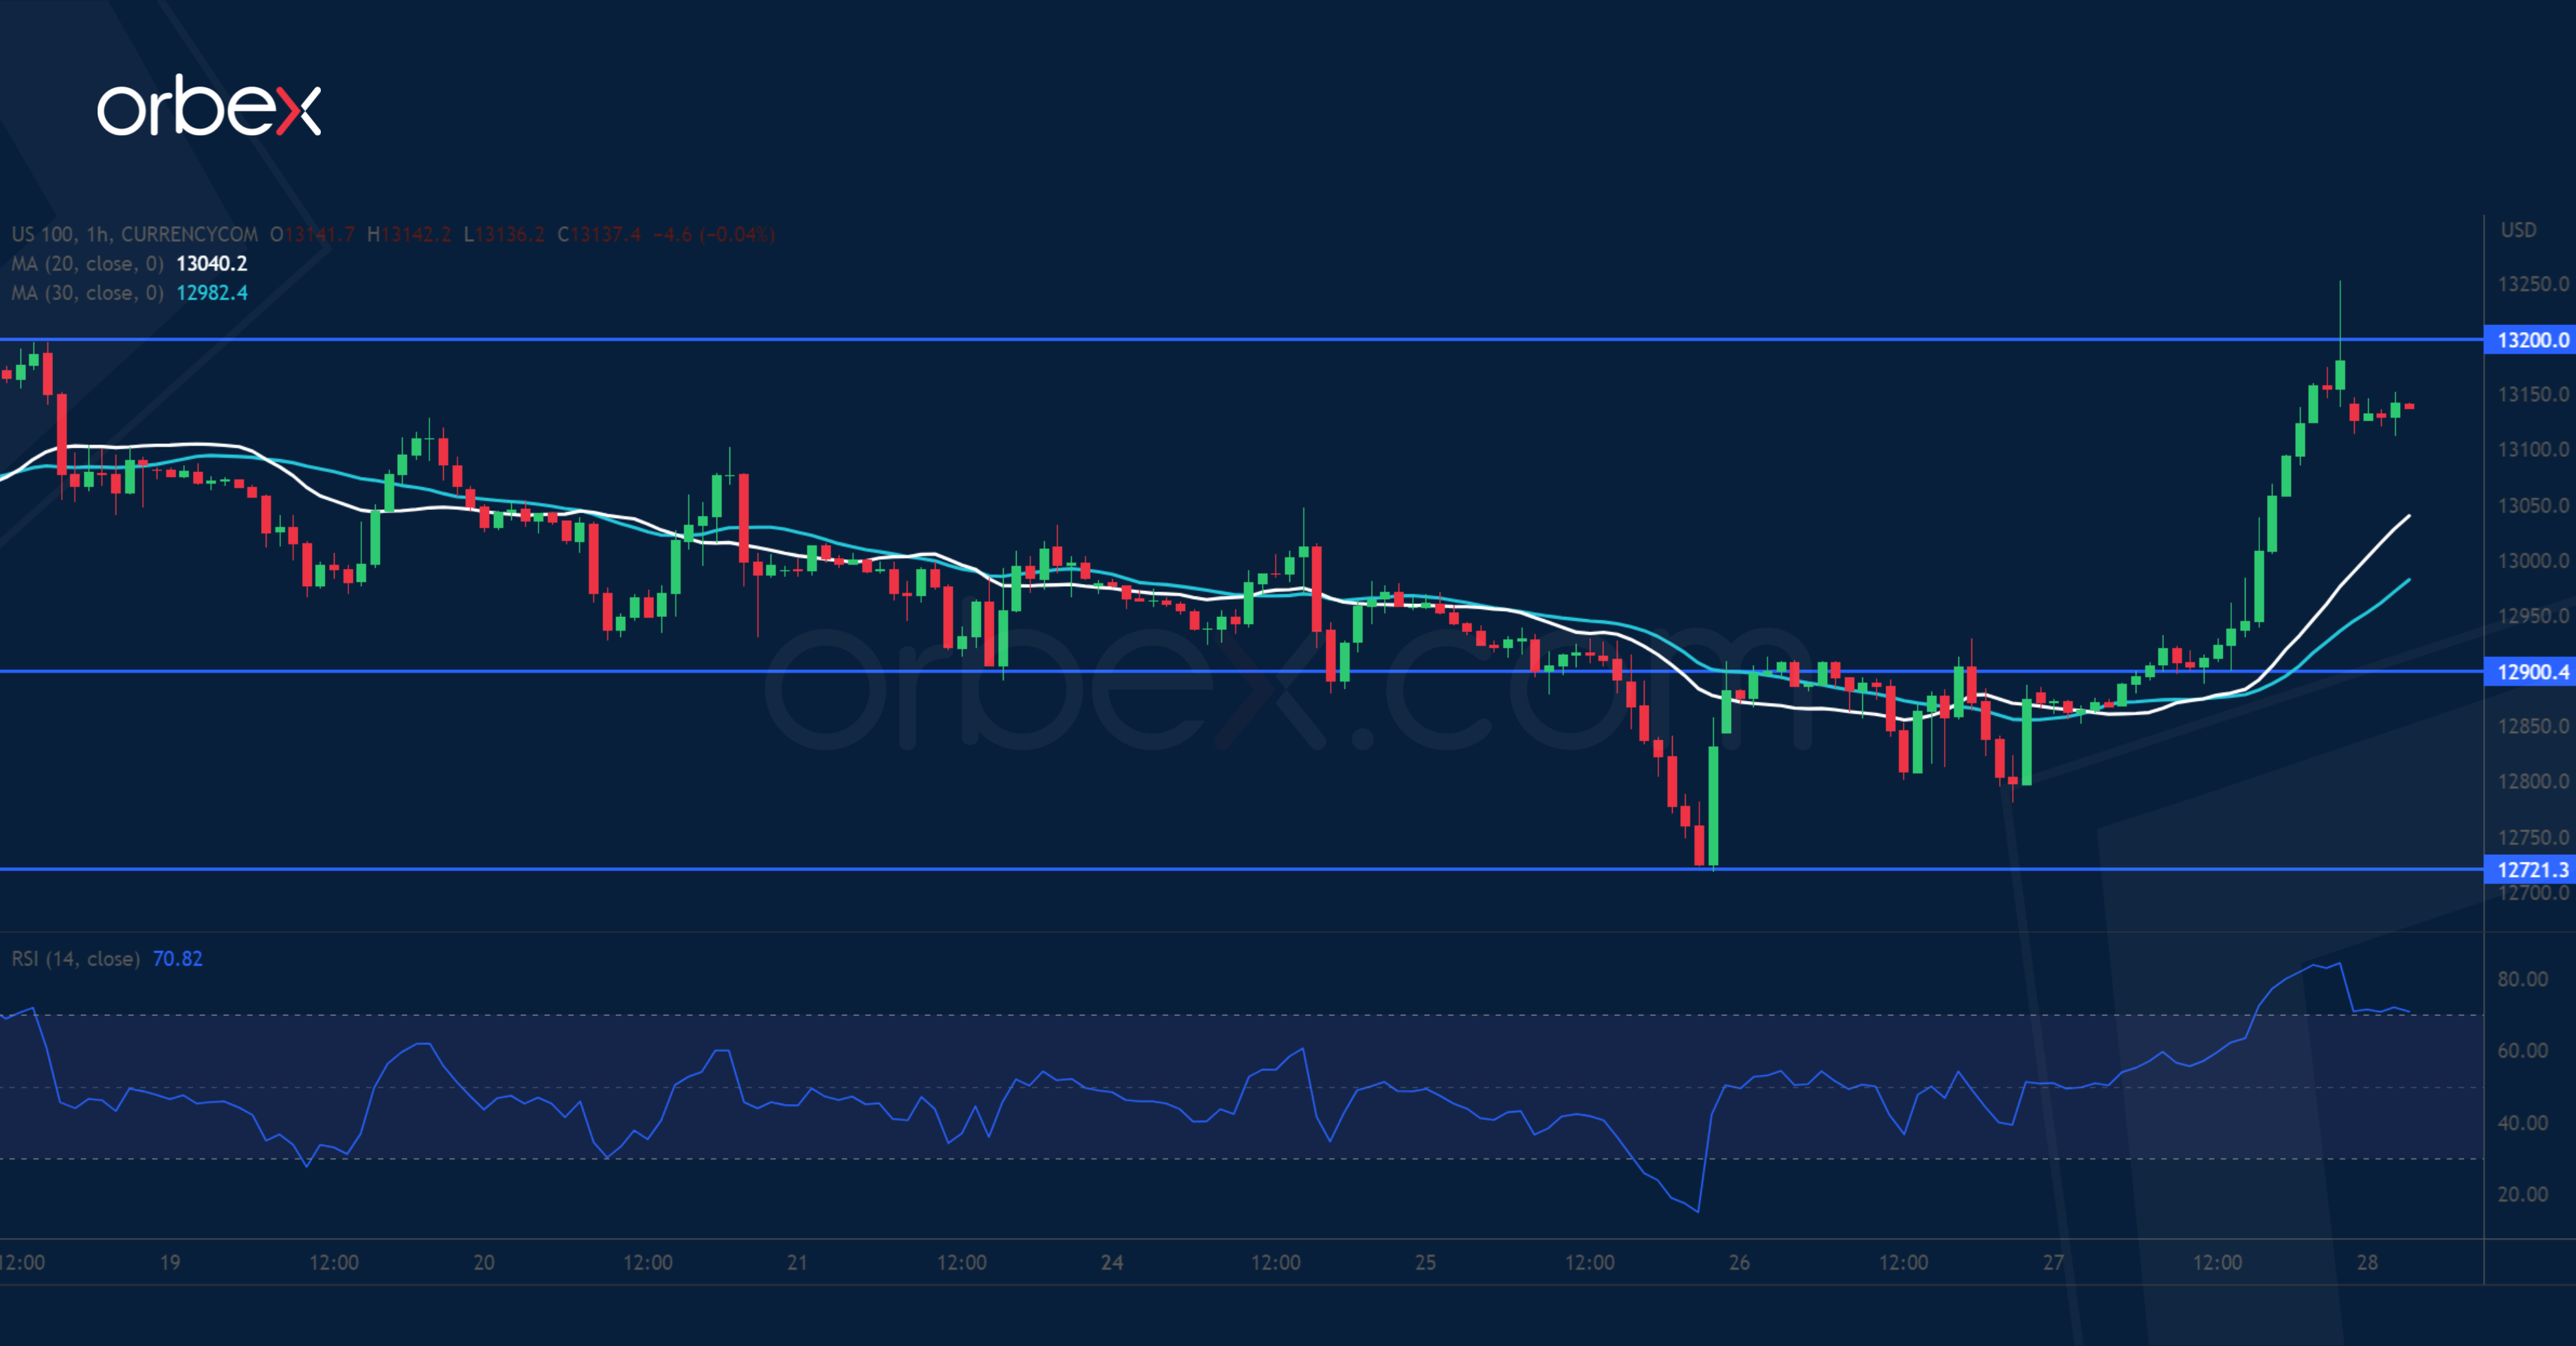
The Nasdaq 100 surged as megacap tech companies reported upbeat results. The medium-term prospect remained upbeat after the price cleared the February high of 12800. This means that the latest pullback would be short-lived and the bulls have seen it as an opportunity to accumulate. As a fresh bullish drive takes out 13030, weakening the selling impetus in the process, a close above 13200 would pave the way for a bullish continuation to 13700. With the RSI shooting into the overbought area 12900 is the first support.

