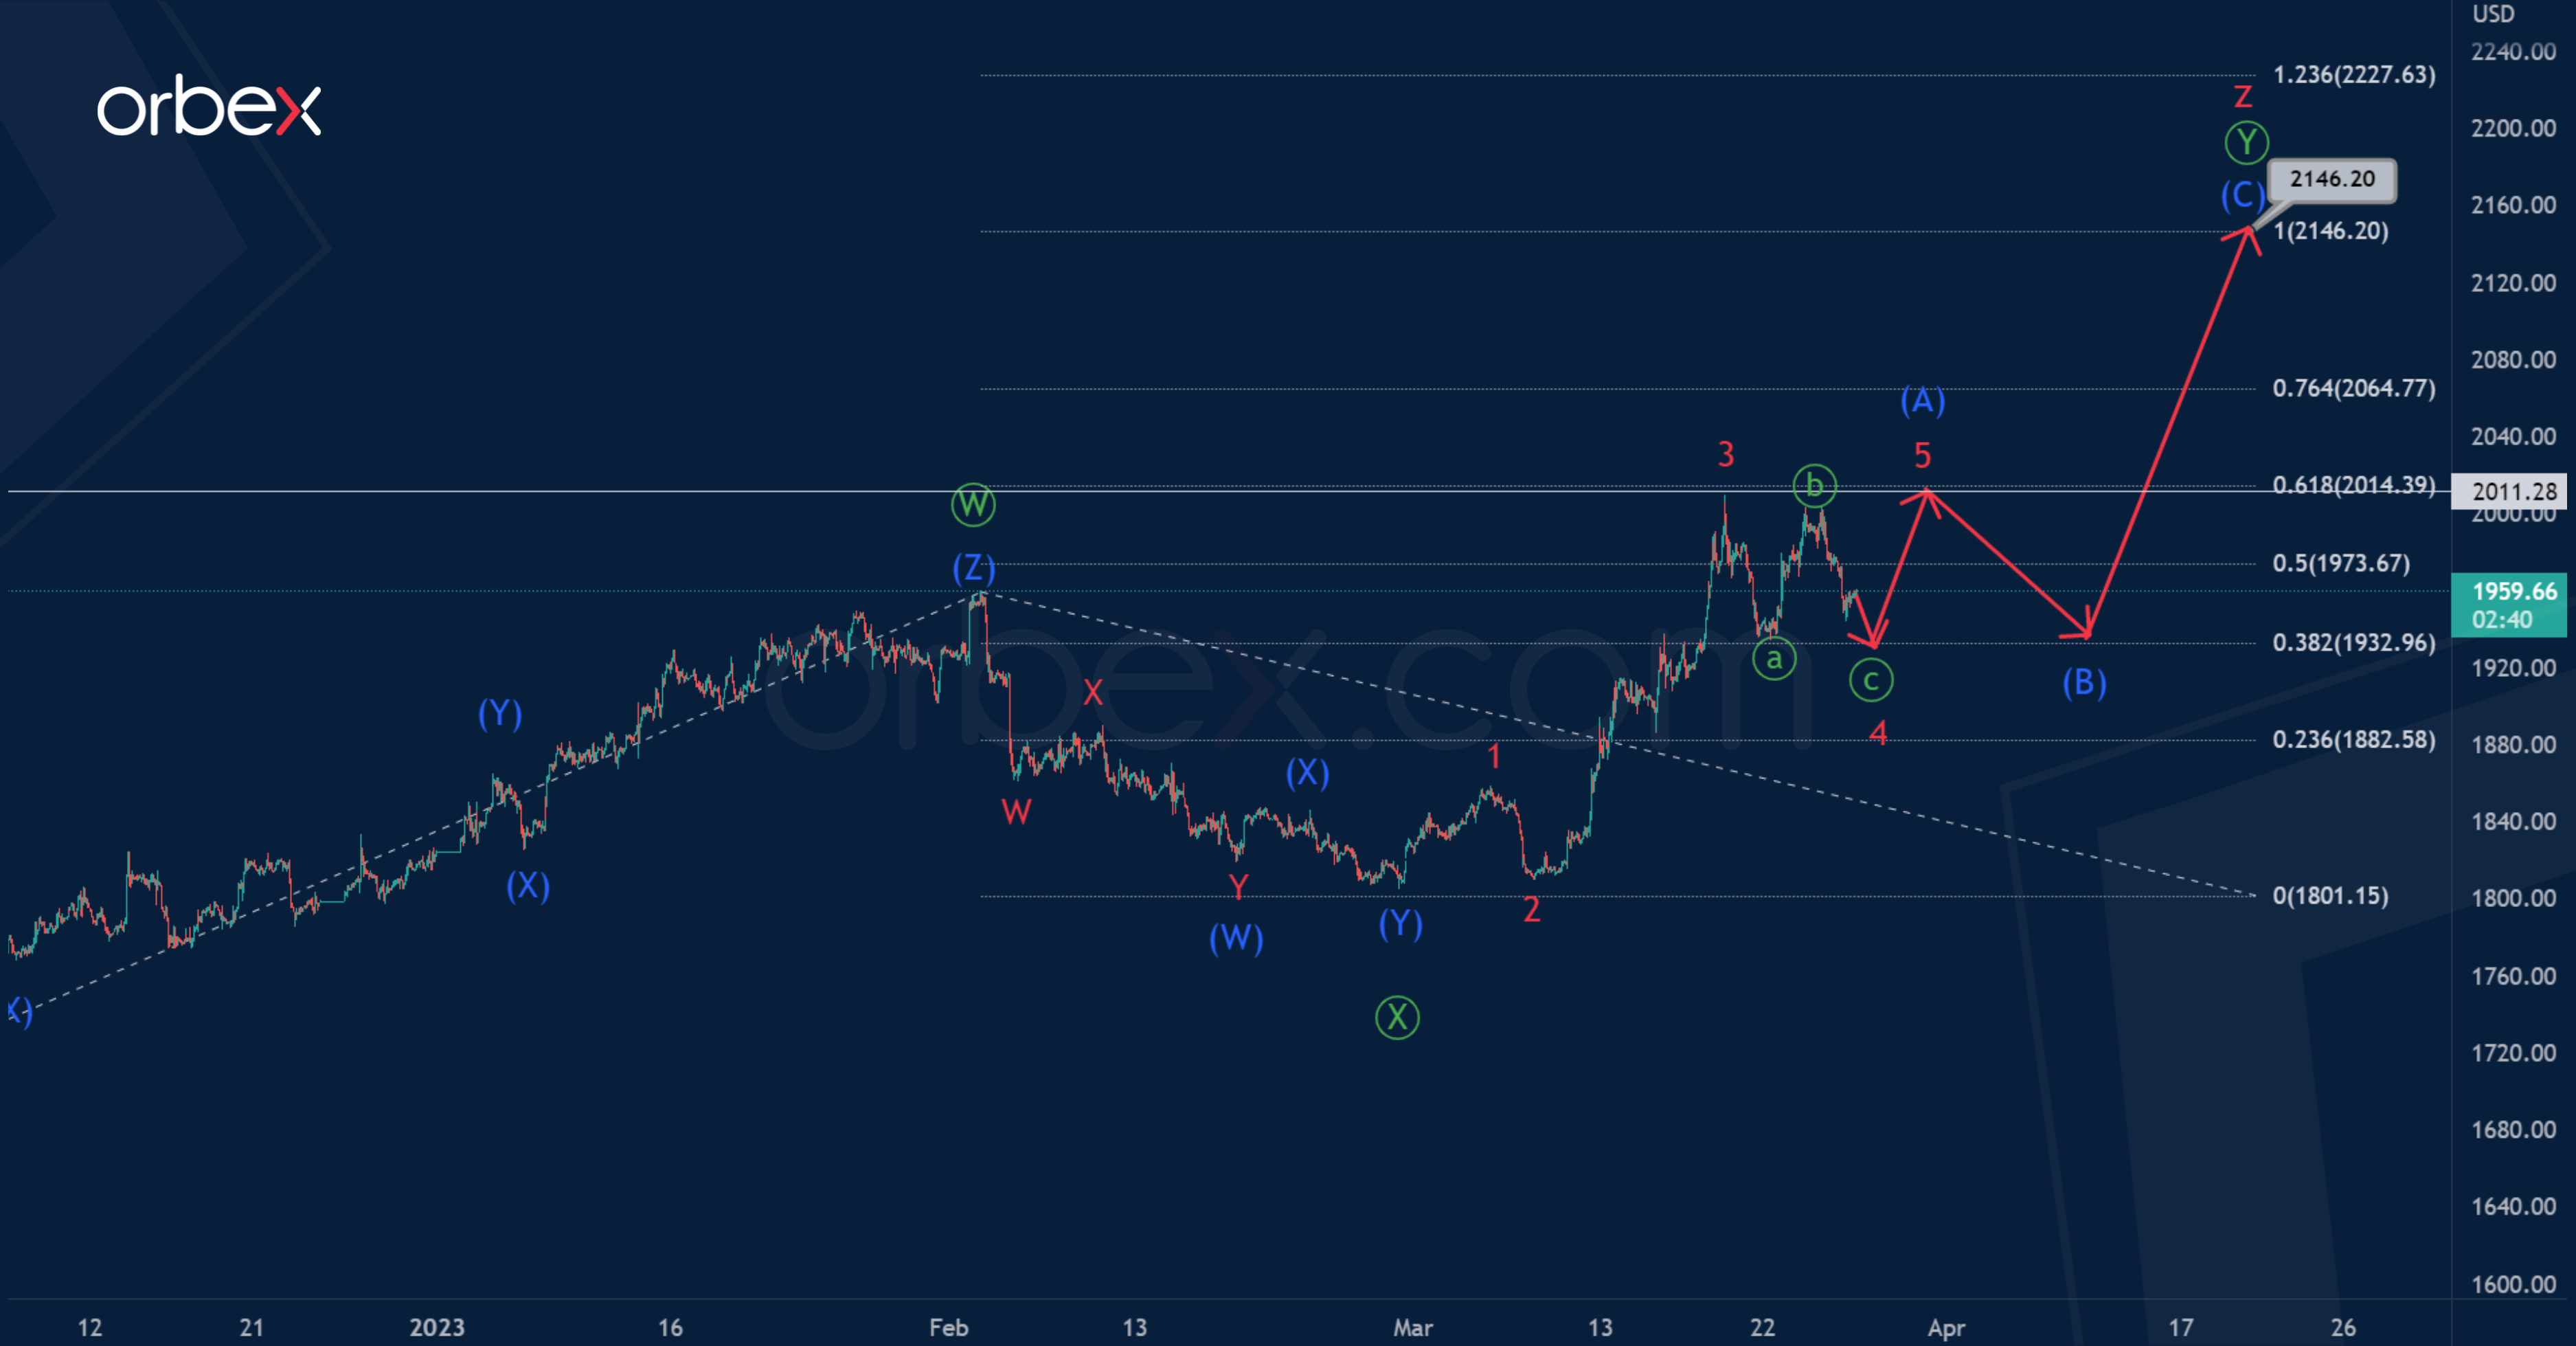
In the medium term, gold is expected to form a double zigzag. This consists of sub-waves Ⓦ-Ⓧ-Ⓨ inside the cycle wave z.
Waves Ⓦ-Ⓧ have already ended and the third sub-wave Ⓨ is currently under development.
Wave Ⓨ could be a standard zigzag structure. Currently, the initial sub-wave (A) is similar to the impulse 1-2-3-4-5. In the near future, the minor correction wave 4 could end, after which the price could rise to the maximum of 2011.28 in the minor wave 5.

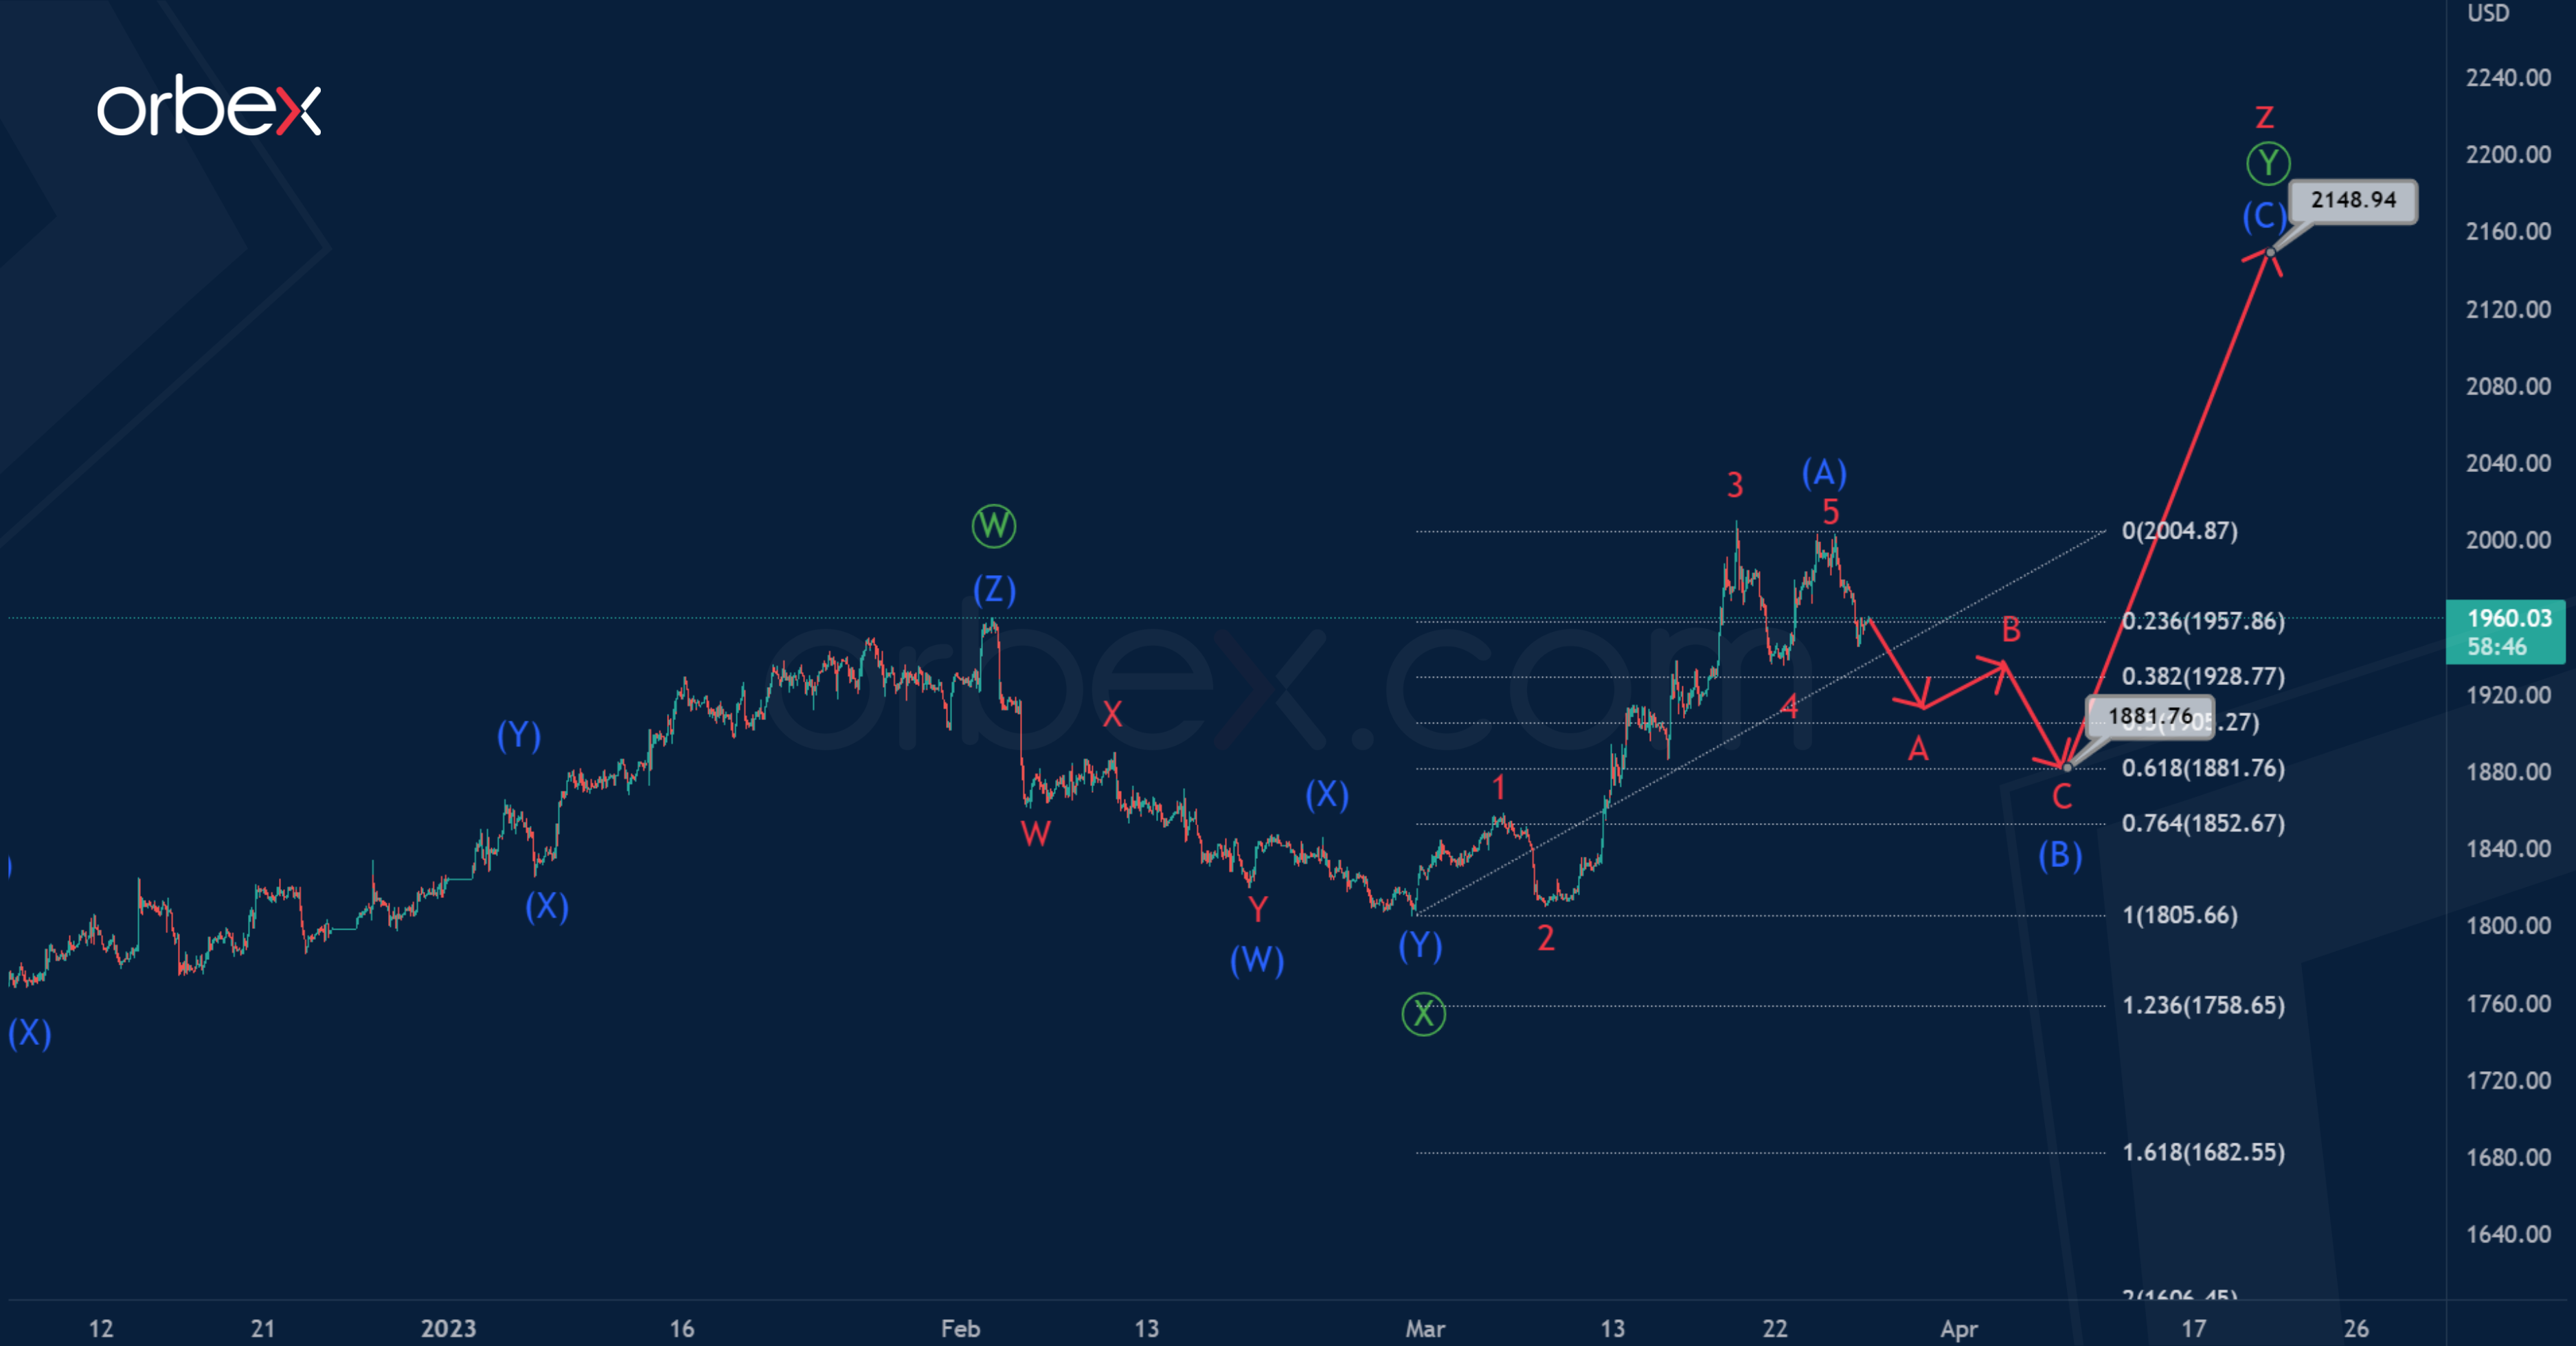
In the second variant, we consider a scenario where the intermediate impulse wave (A) is fully completed. Its fifth wave is a truncated impulse.
Thus, in the next coming trading days, a price decline and the development of an intermediate correction (B) is likely. There is a high probability that this correction will take the form of a standard zigzag A-B-C, as shown on the chart.
The end of the wave (B) can be expected closer to 1881.76. At that level, it will be at 61.8% of impulse (A).

