
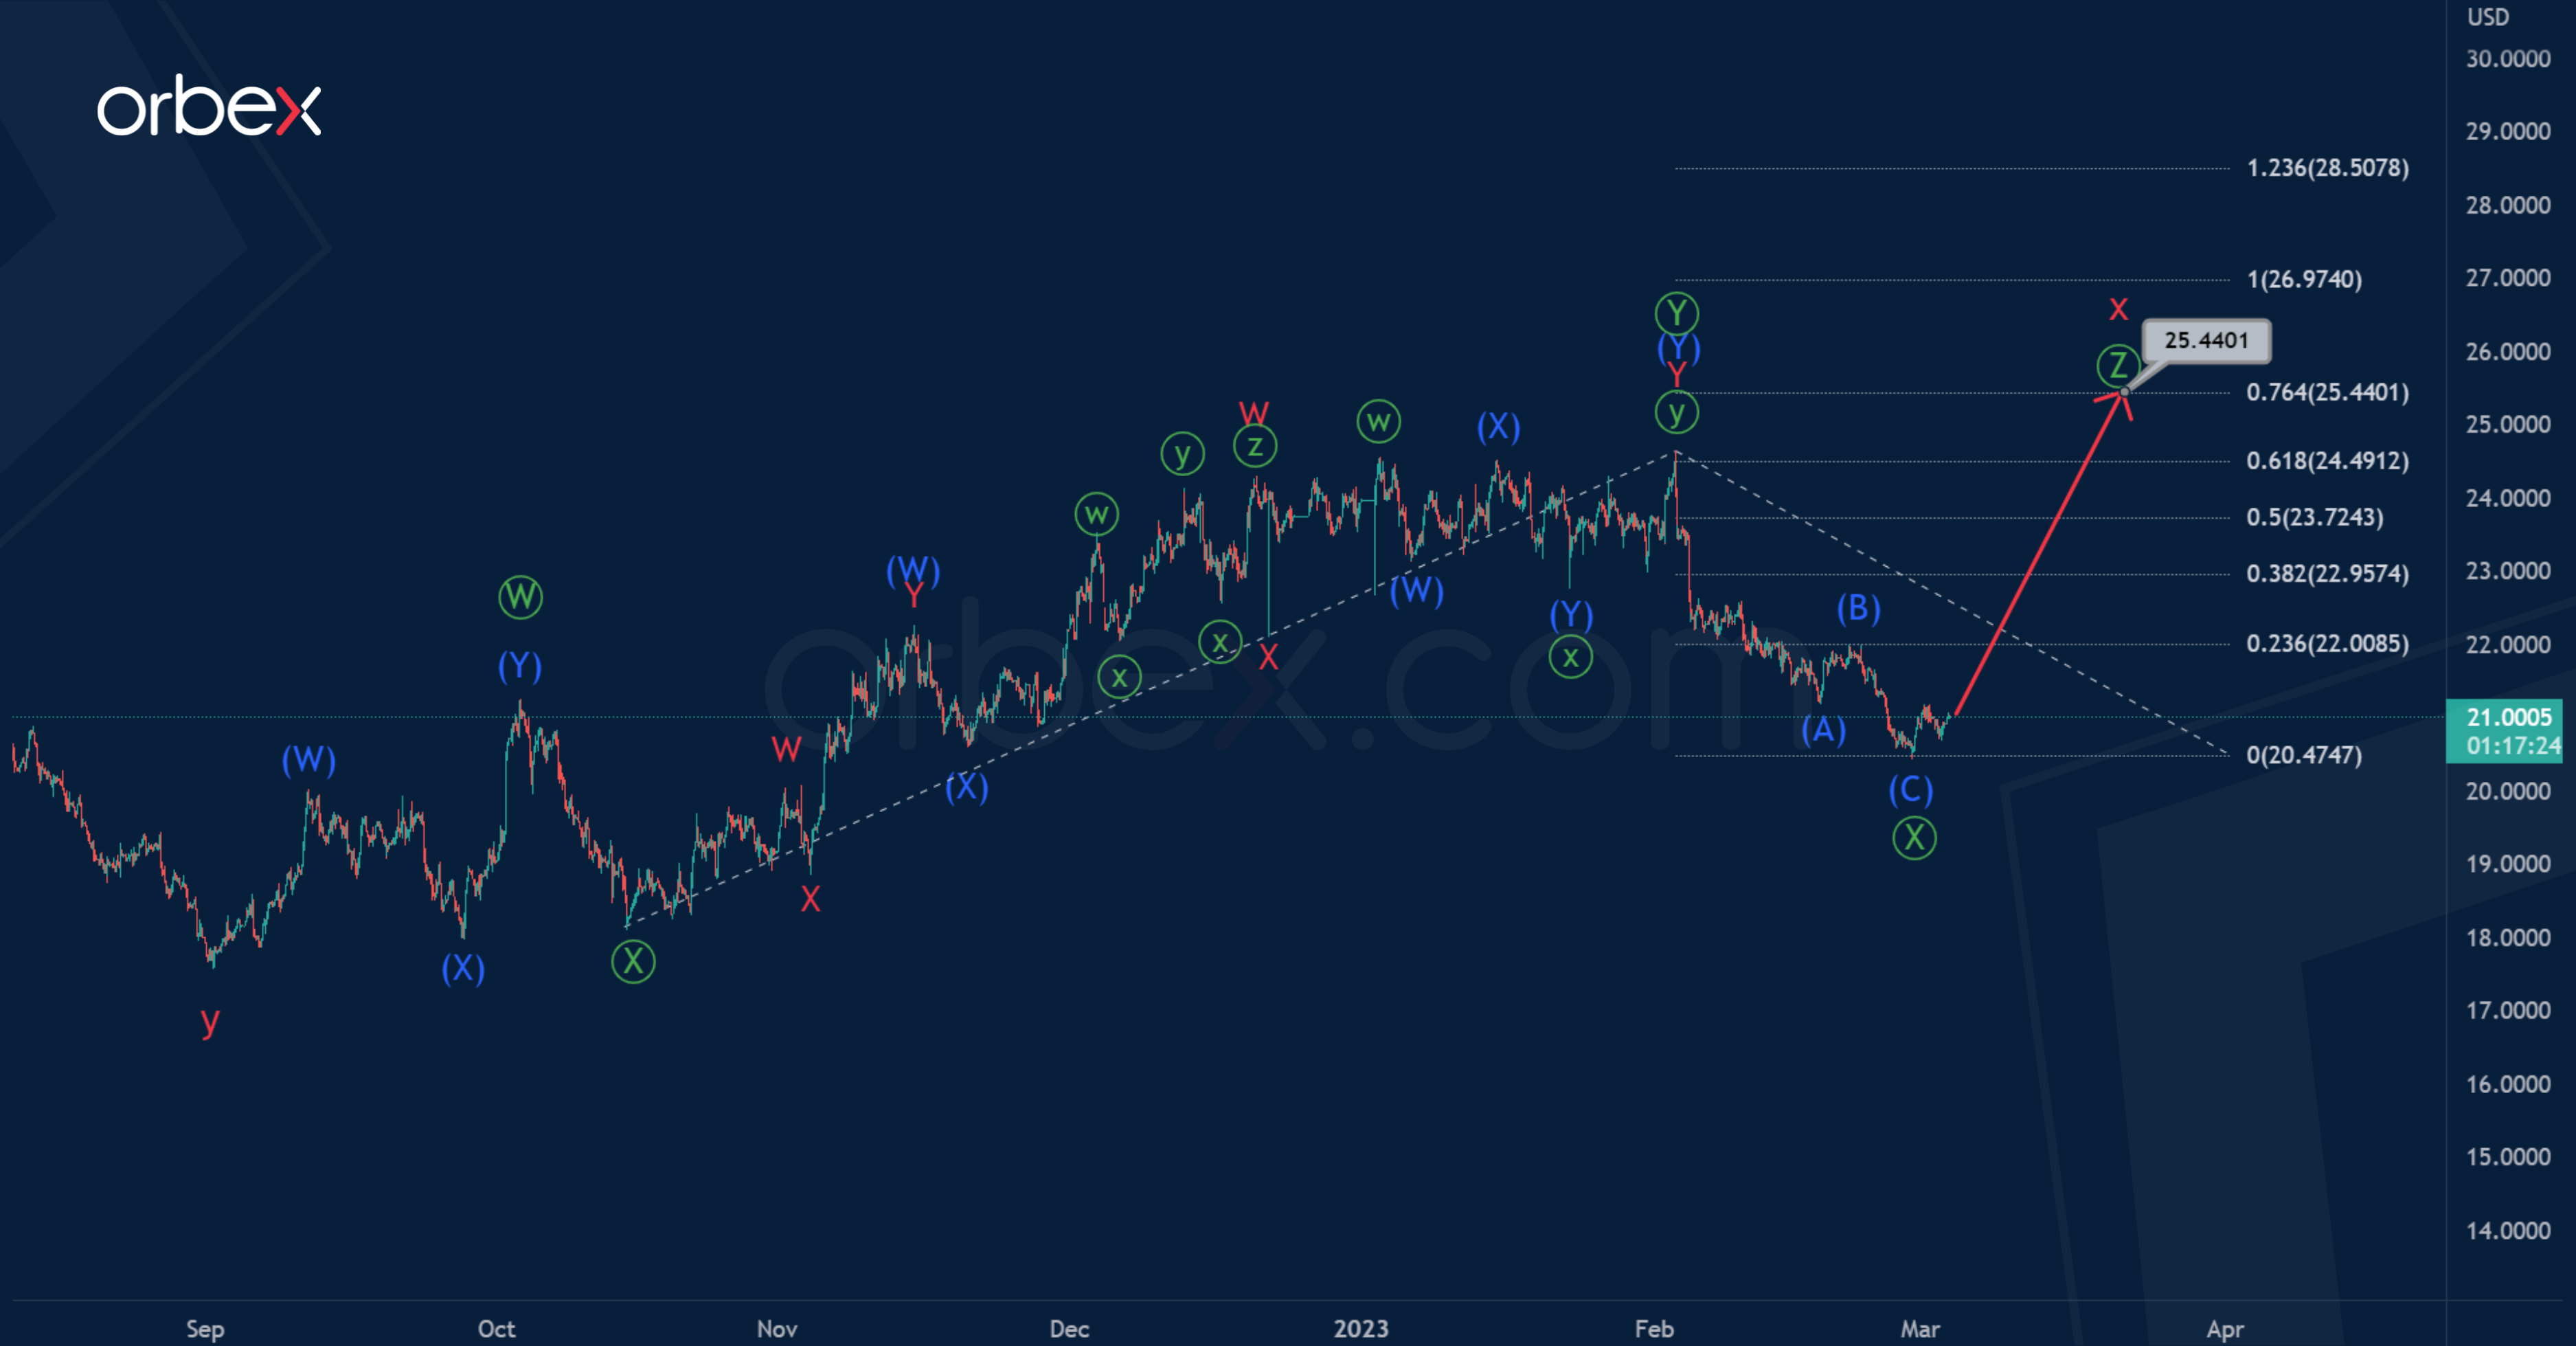
XAGUSD suggests the formation of a global triple zigzag consisting of cycle waves w-x-y-x-z.

On the current chart, we can see the internal structure of the second intervening wave x. This could soon end and be a triple zigzag of the primary degree Ⓦ-Ⓧ-Ⓨ-Ⓧ-Ⓩ.

The primary wave Ⓨ consists of intermediate waves (W)-(X)-(Y) and looks finished. Perhaps the primary intervening wave Ⓧ could also come to an end, at the moment it has the form of a zigzag (A)-(B)-(C).
Now market participants can expect growth in the primary wave Ⓩ to 25.440. At that level, it will be at 76.4% of wave Ⓨ.
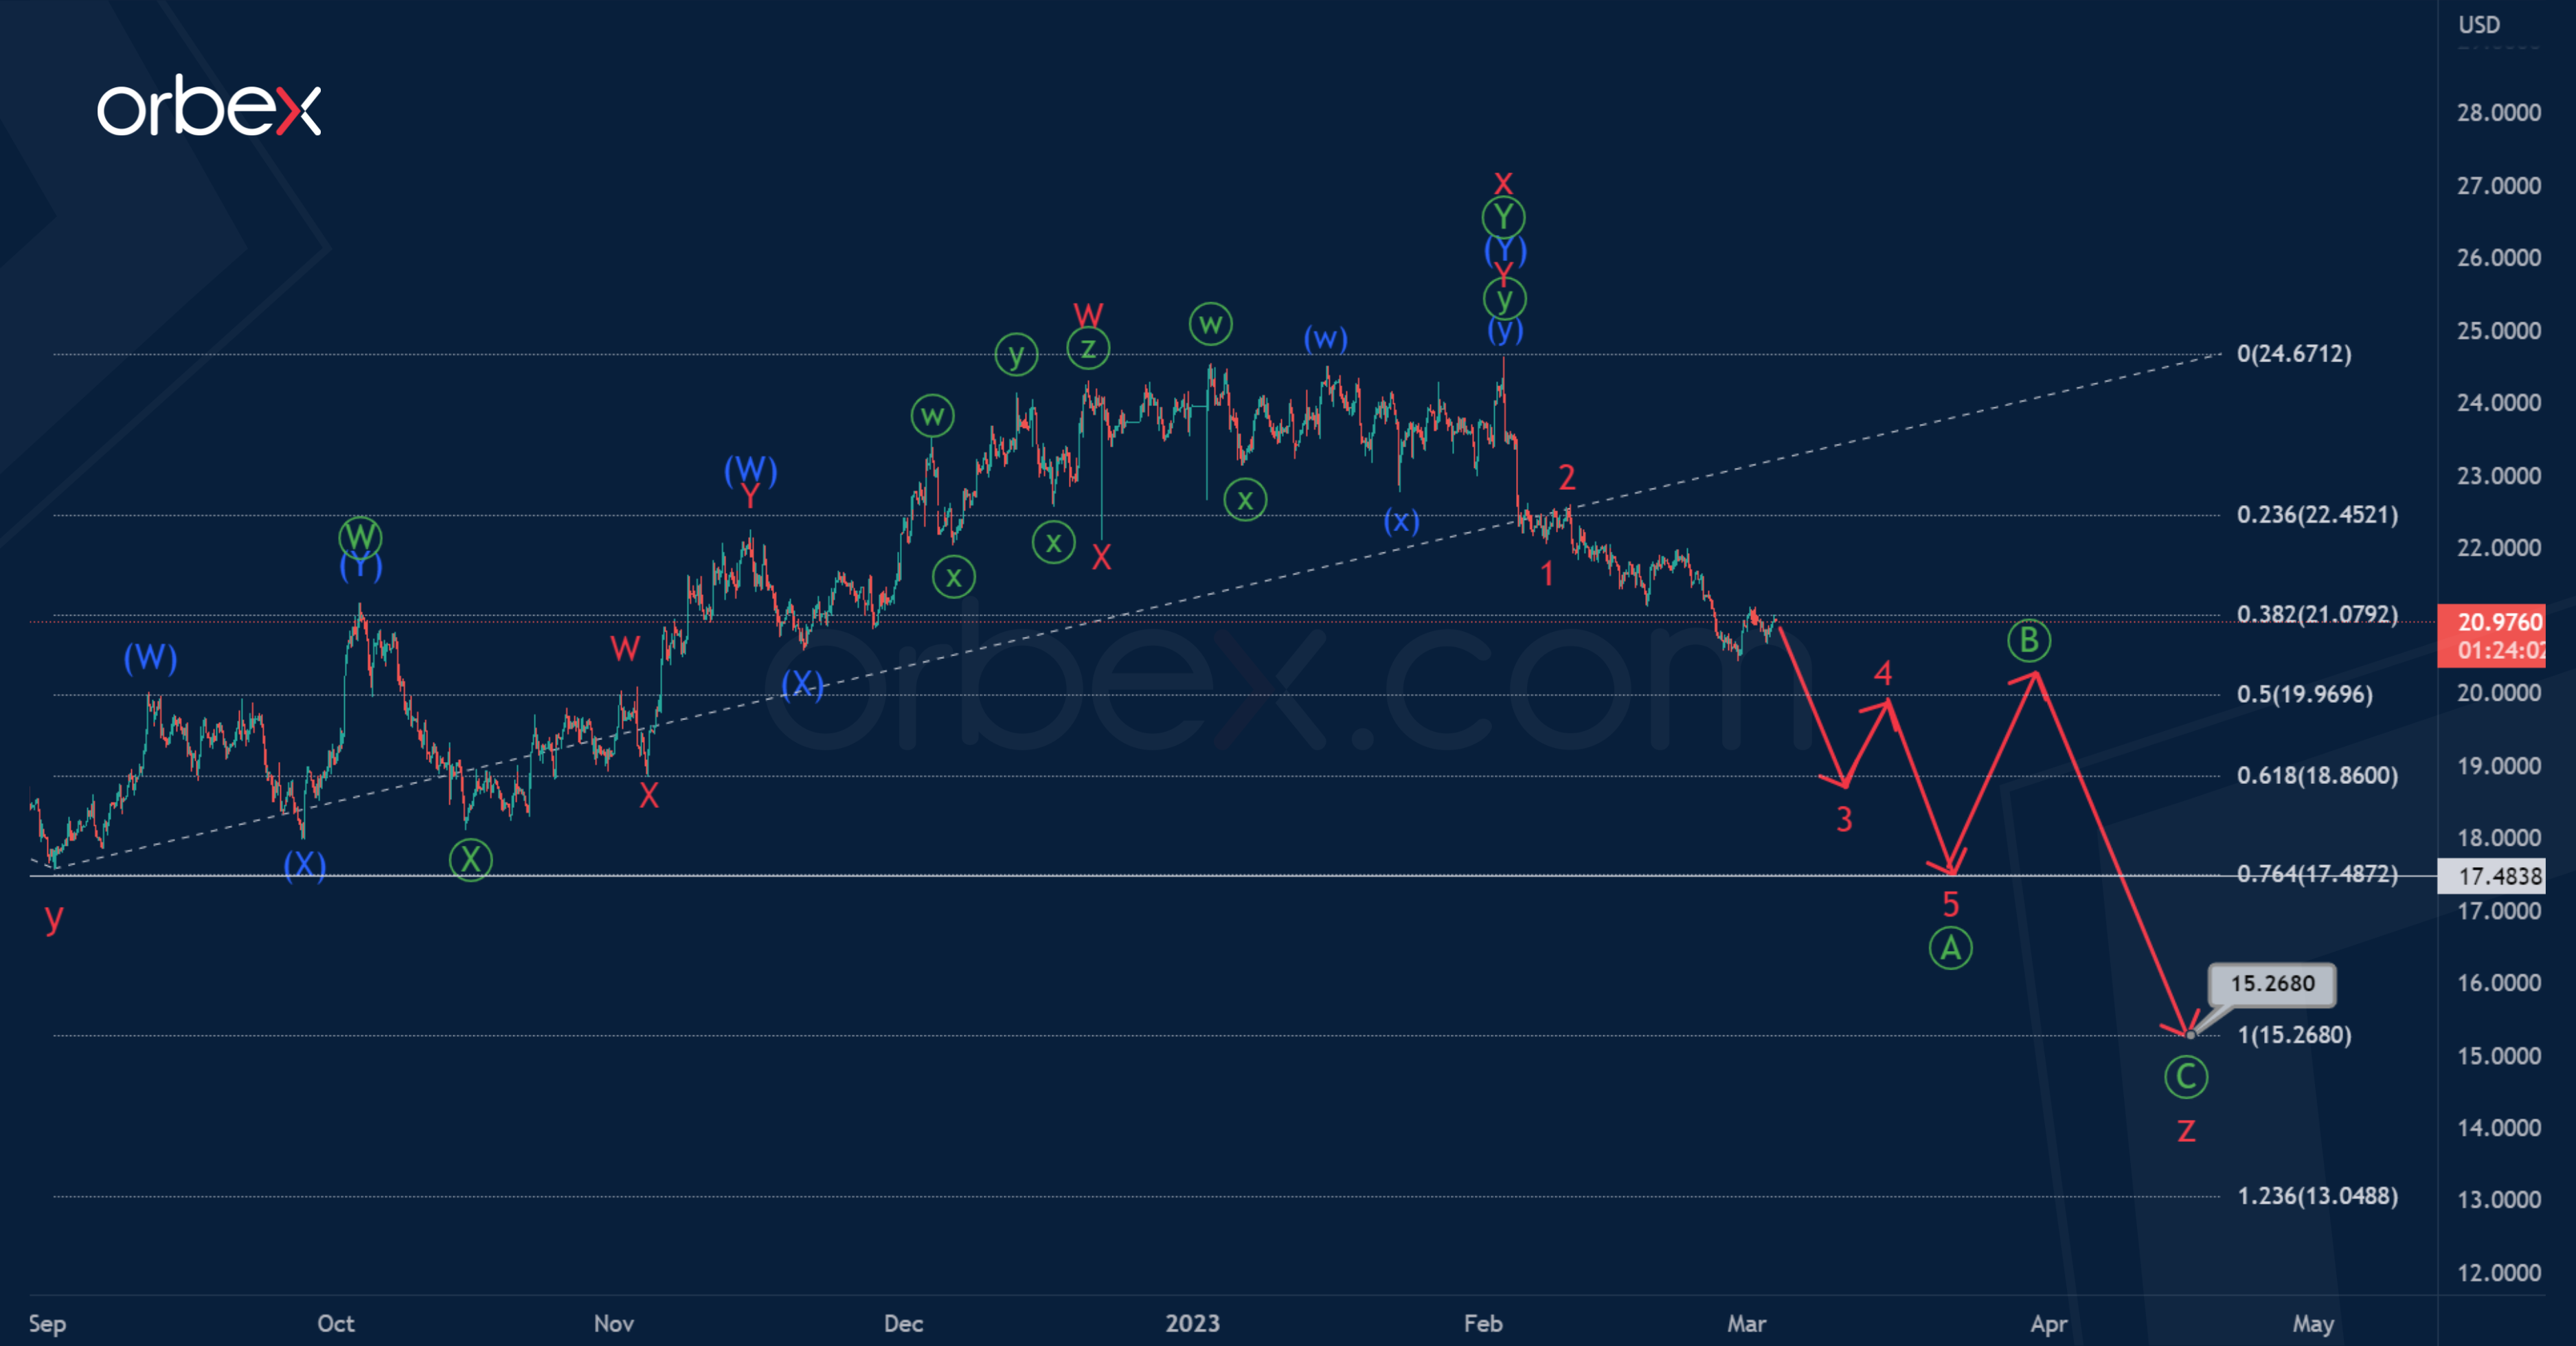
Let’s now look at an alternative markup option, where the development of the cycle intervening wave x has ended. In the last section we see the initial part of a new bearish wave z.
Perhaps wave z will be a standard zigzag, as shown on the chart, and will complete near 15.268. At that level, it will be at 76.4% of actionary wave y.
The nearest target where the price can reach is 17.483. A cycle wave y marks this. Here the impulse sub-wave Ⓐ can end, and an upward correction Ⓑ can begin.

![Credit Card 160×600 [EN]](https://assets.iorbex.com/blog/wp-content/uploads/2023/06/13144507/Blog-Banner_EN-Banner_160X600X2.webp)