
GBPUSD tests resistance
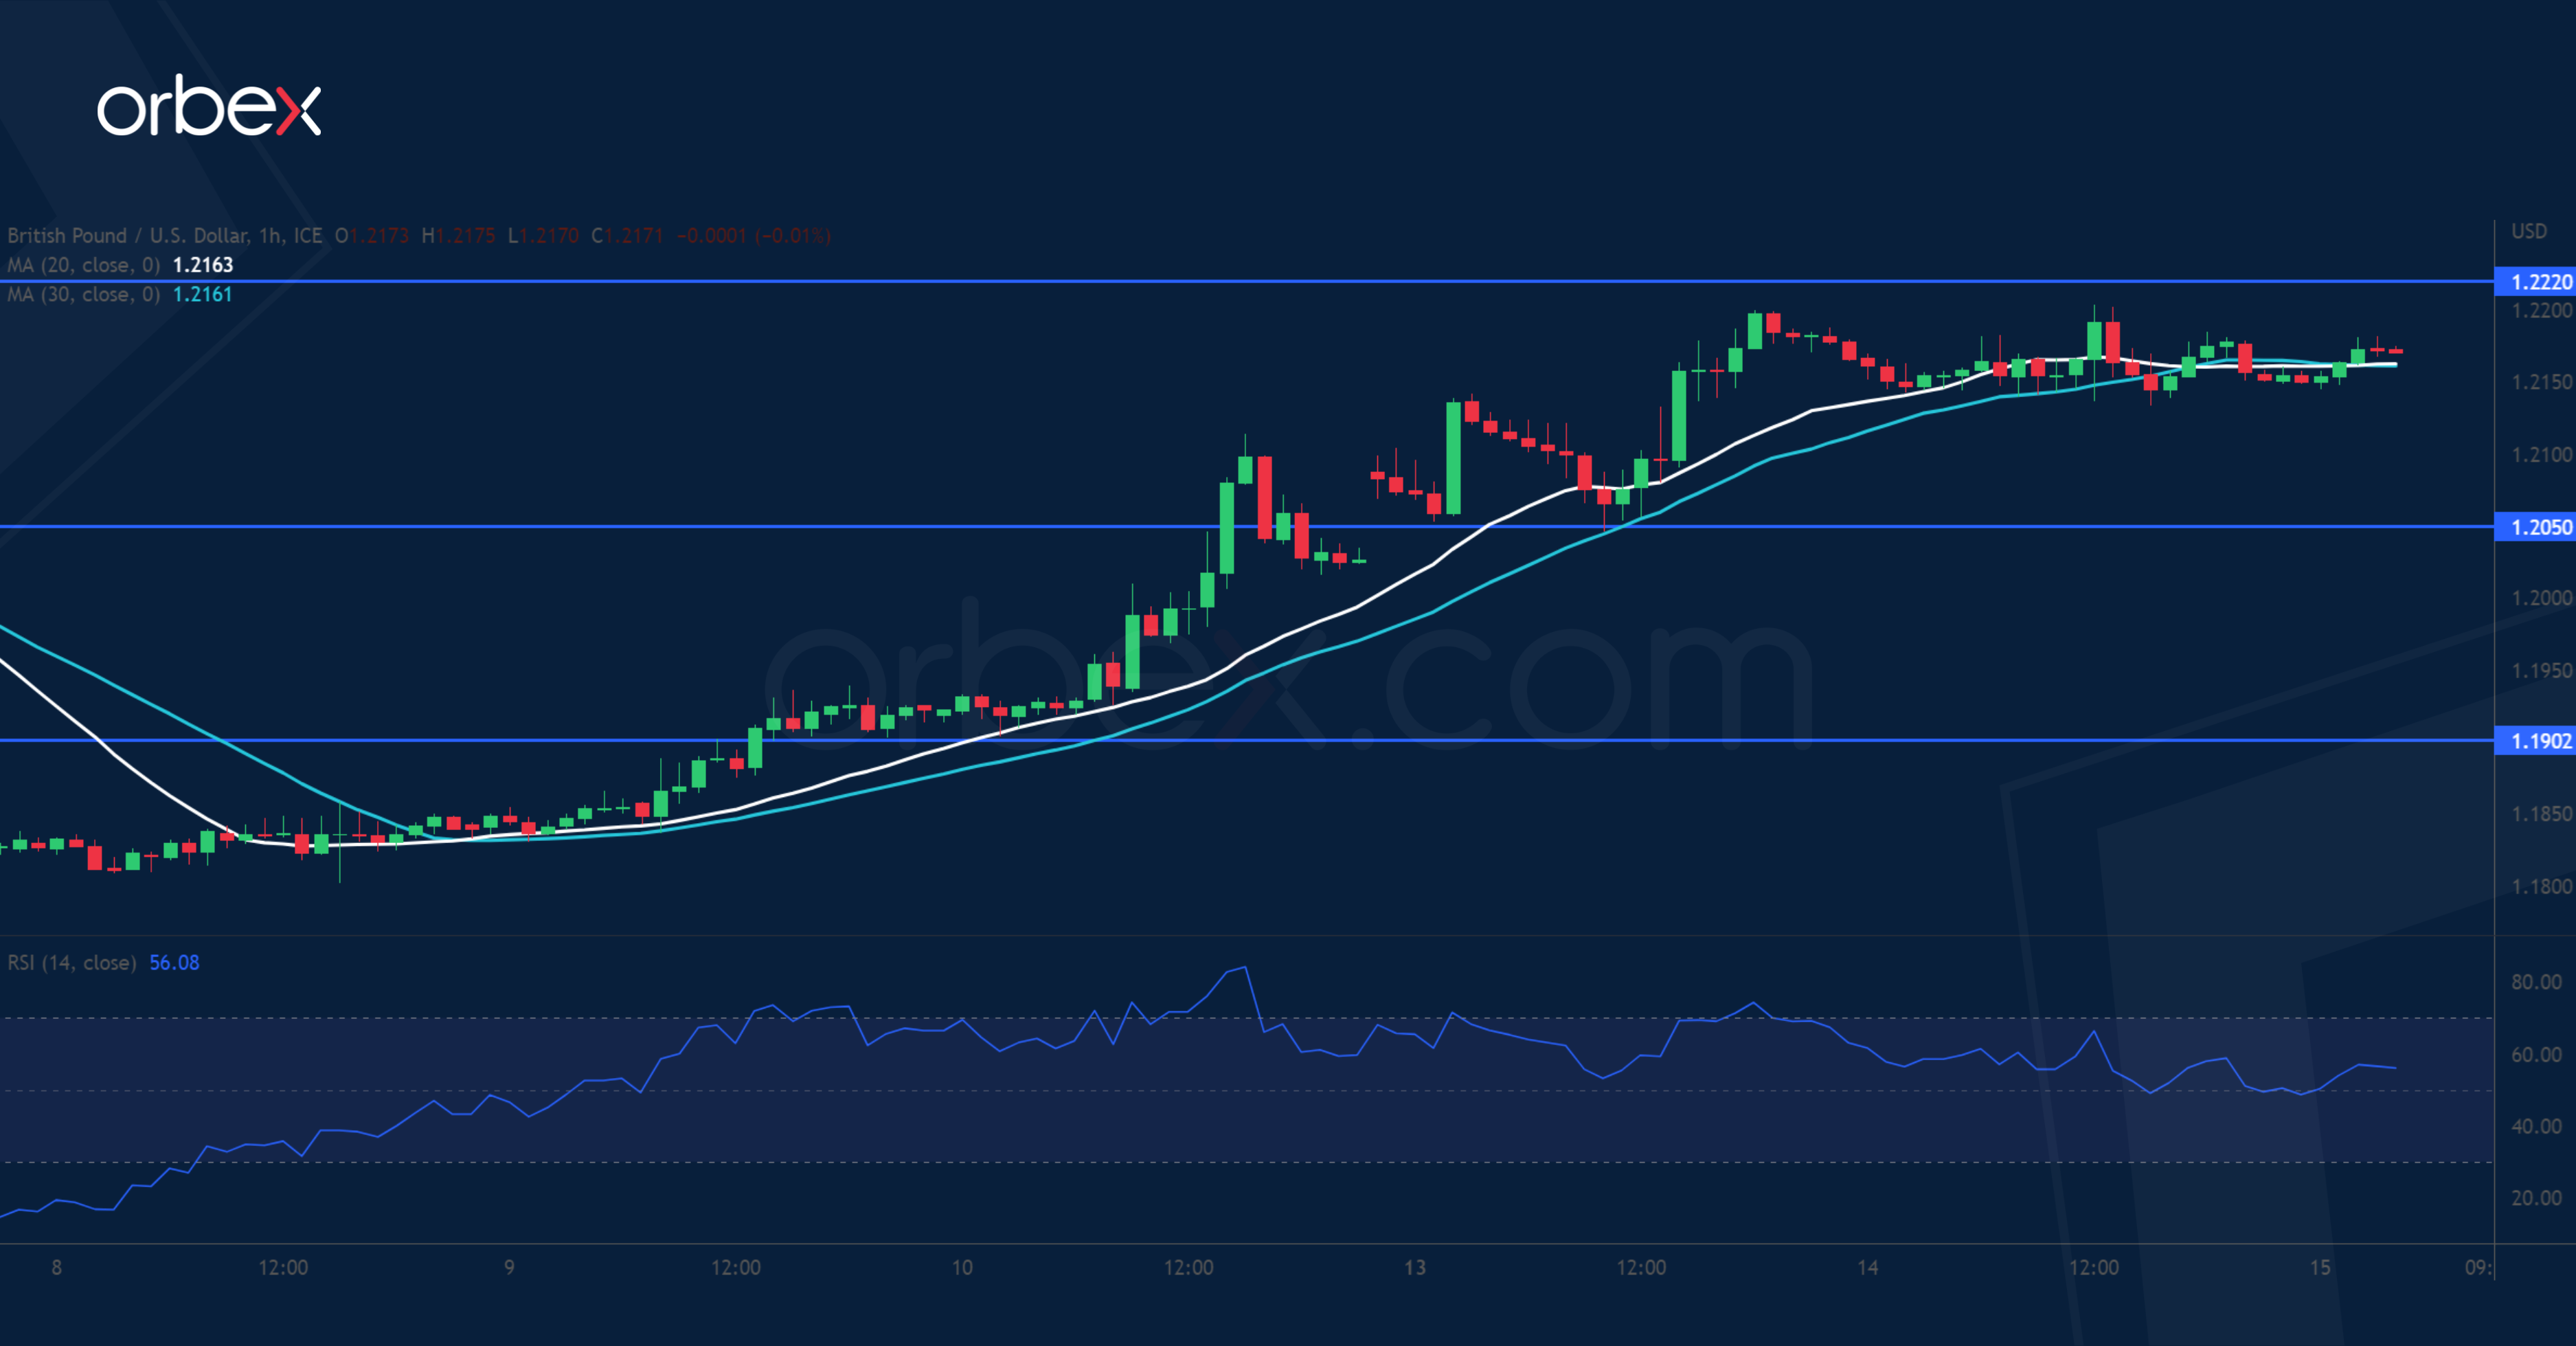
The US dollar struggles as data show a slowdown in headline inflation in February. Cable’s recovery above 1.2050 then the double top at 1.2140 has put the pair back on track after a three-month long consolidation. 1.2050 has turned into a support to keep the latest momentum going while 1.1900 further down is where the bulls would draw a line in the sand. A close above the mid-February spike of 1.2220 may extend gains to this year’s high at 1.2430, which would be a step closer to a bullish continuation in the medium-term.
XAUUSD grinds supply area

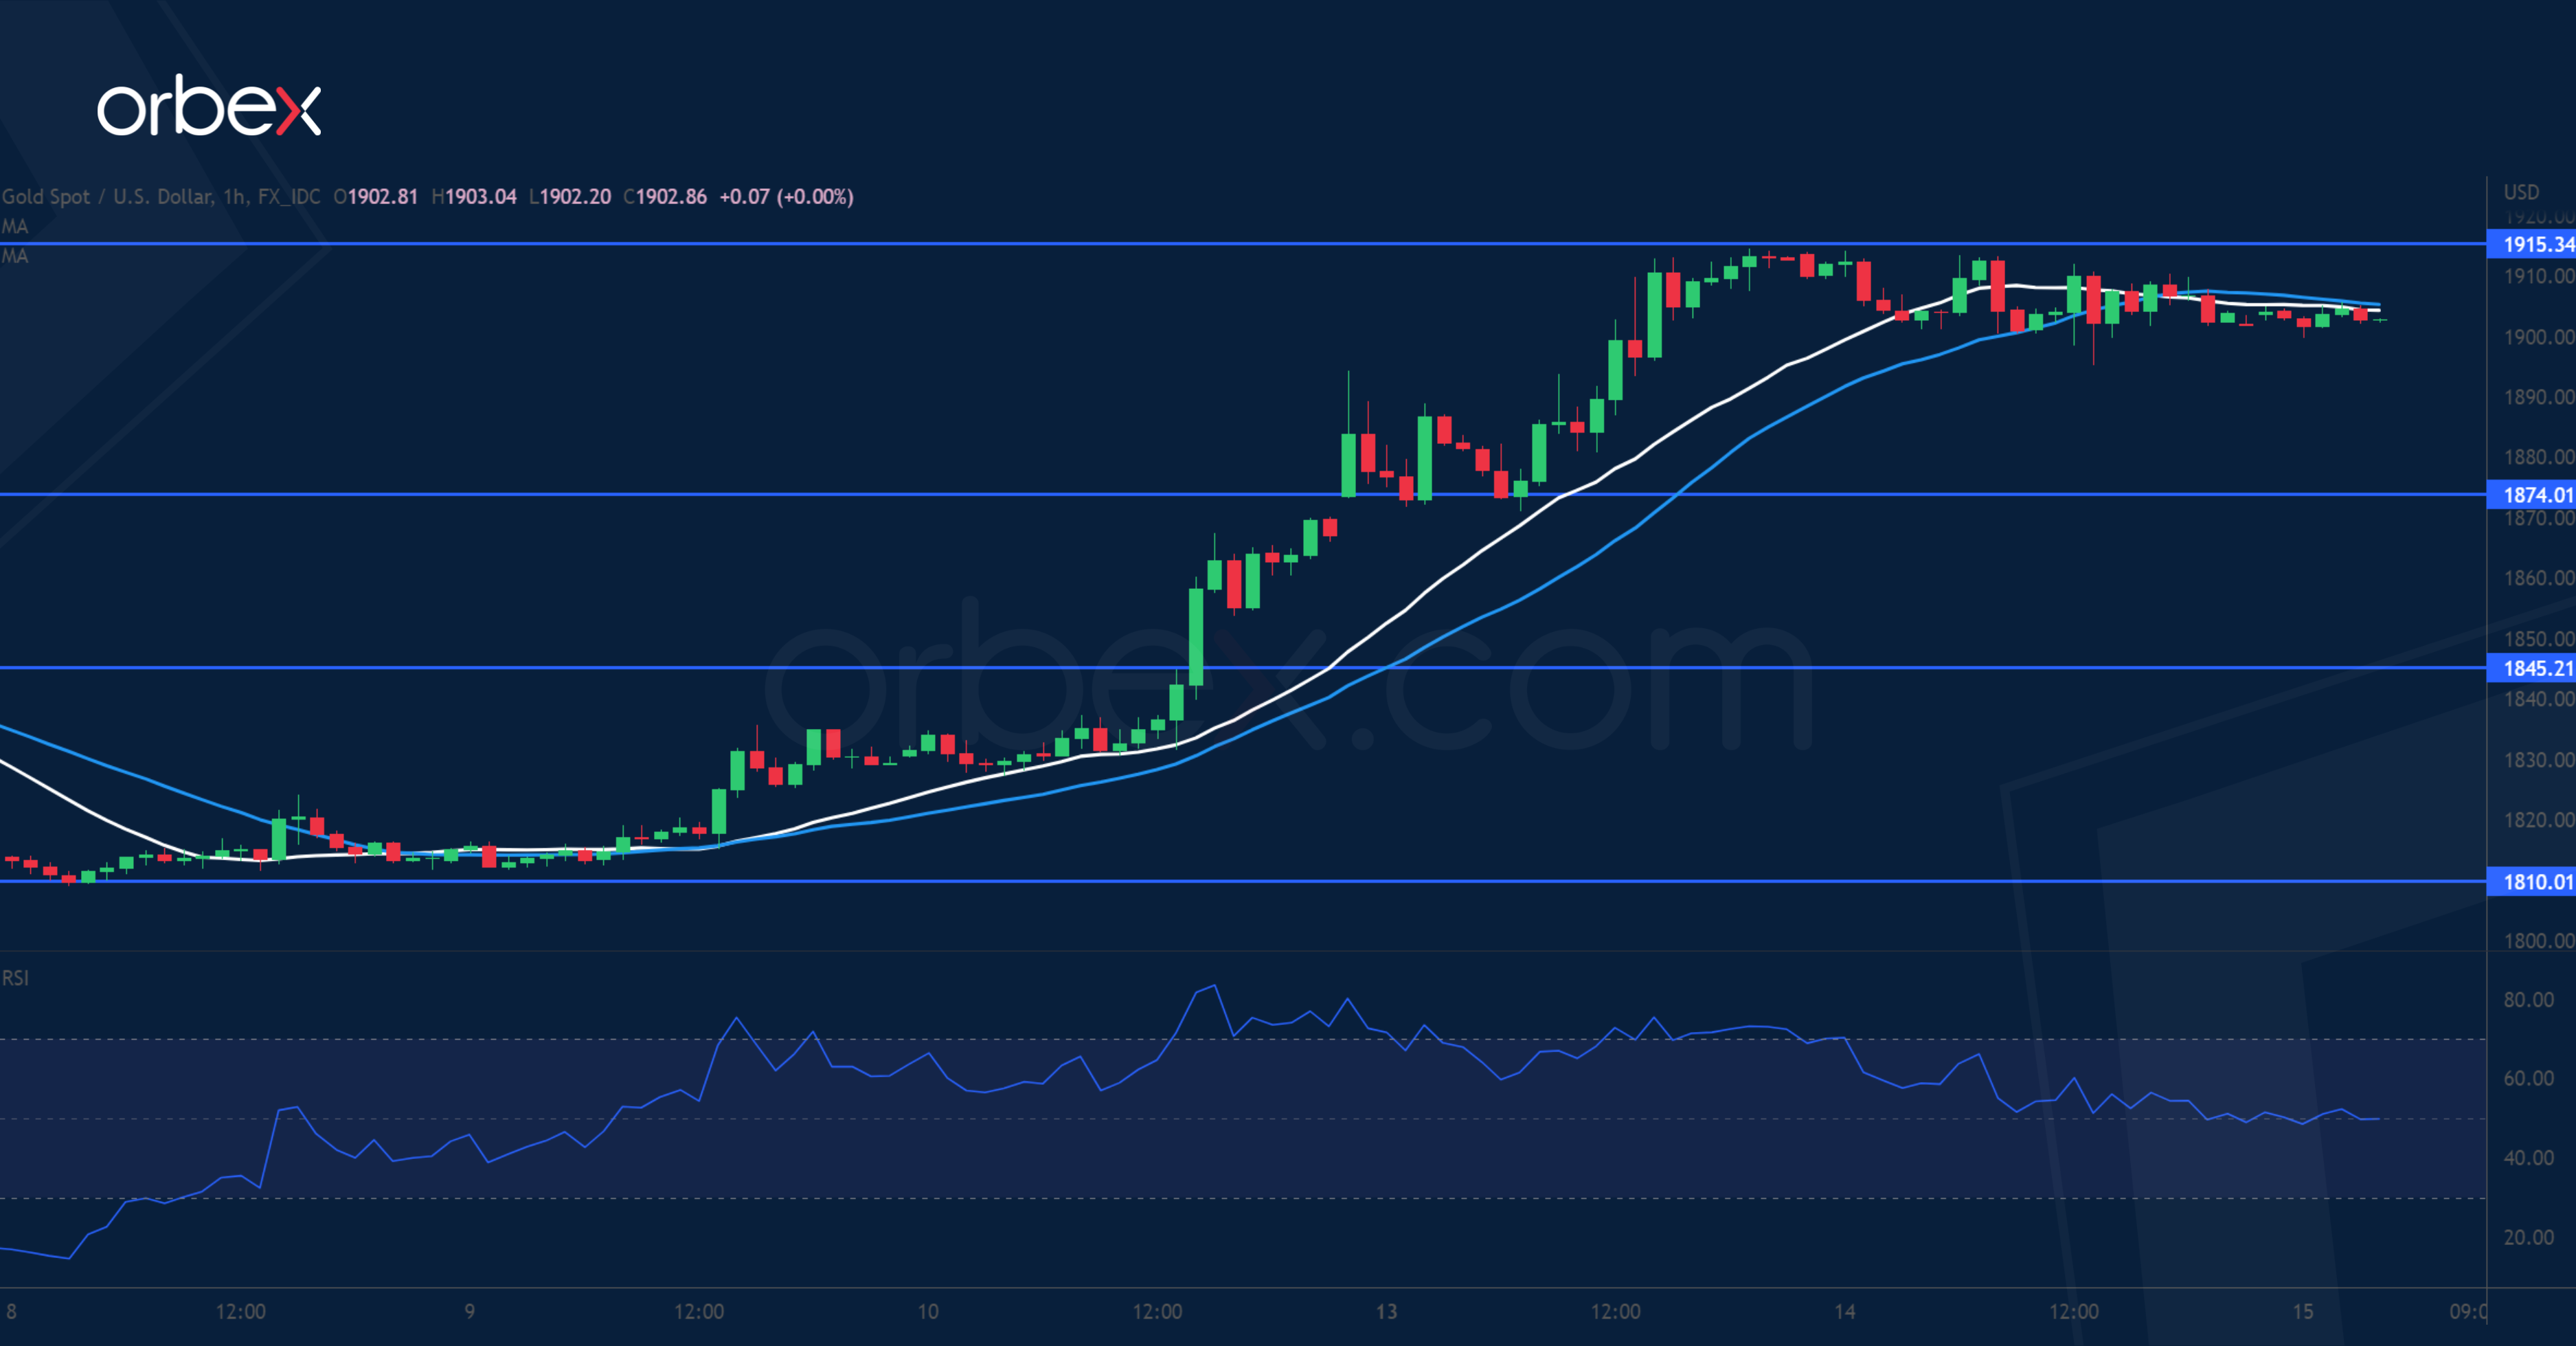
Gold keeps the high ground as the US dollar remains under pressure across the board. On the daily chart, solid bullish candles have sent the price to the supply area around 1915 at the start of the February sell-off. As the RSI comes off the overbought zone the bulls could use some breathing room before they would push even higher. 1874 is the immediate support to gauge the strength of follow-up bids. Further down, 1845 near the moving averages sits at the origin of the bullish breakout, making it an important support.
UK 100 bounces off critical floor
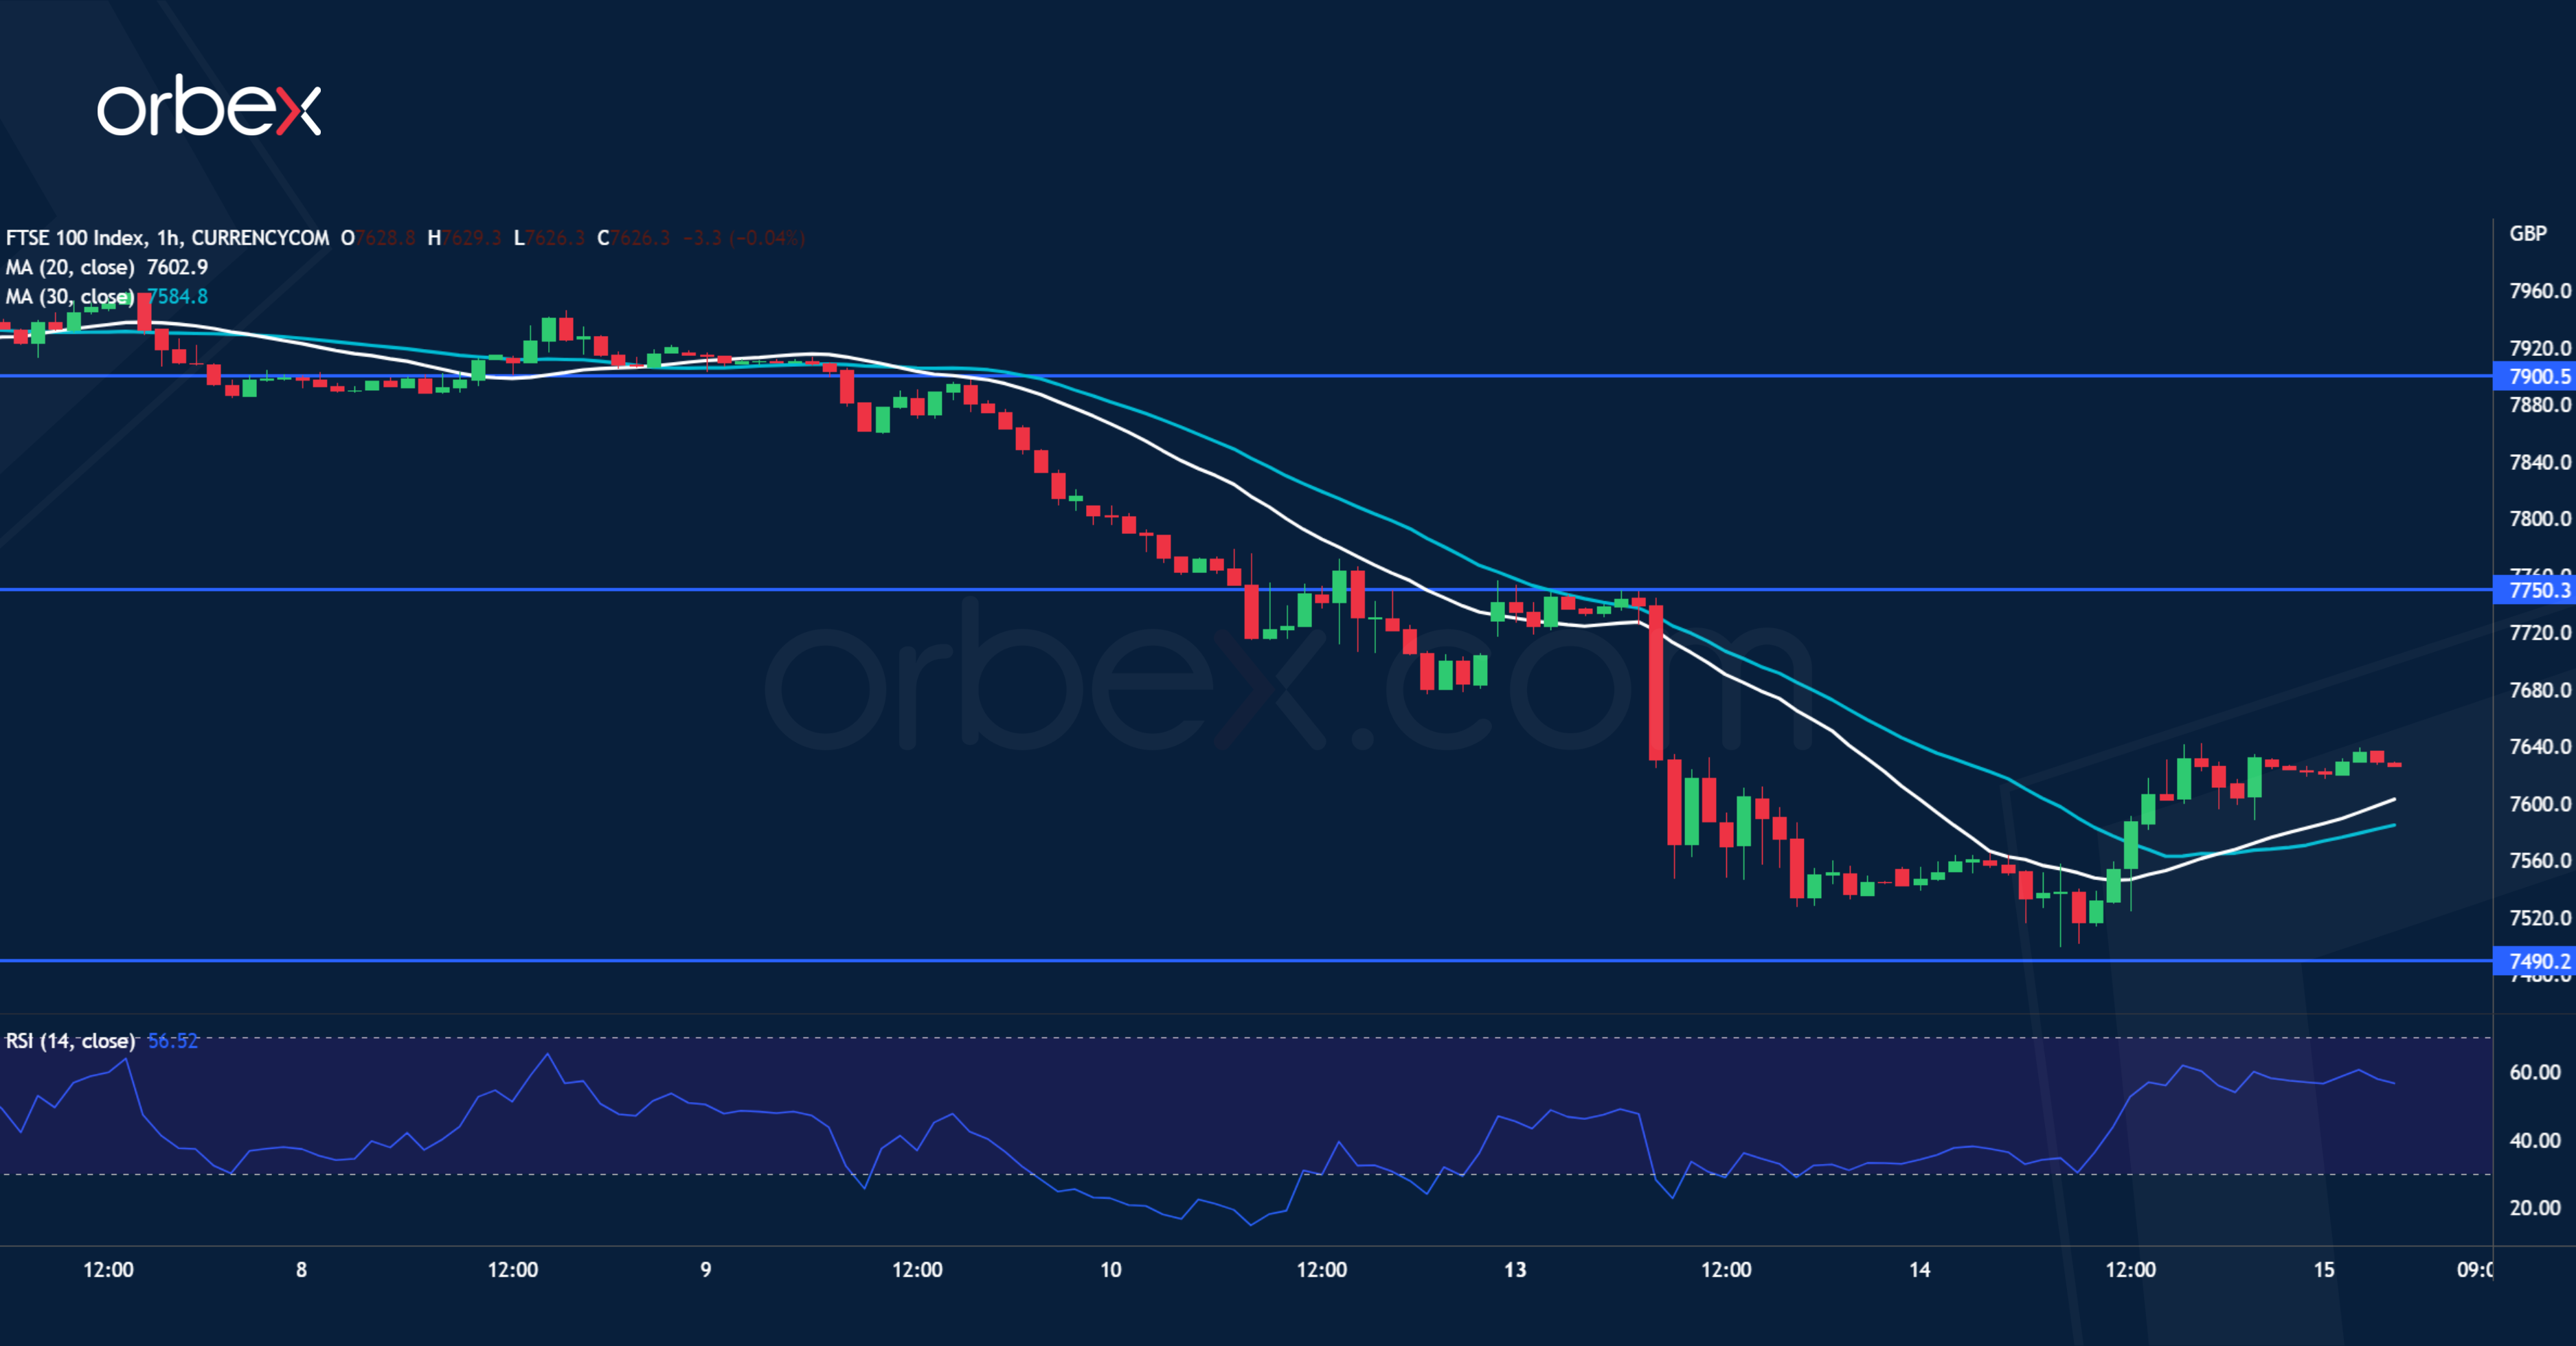
Equities bounce back as traders trim their bets of aggressive tightening by central banks. The FTSE 100 has tumbled to the base of a breakout rally in early January near 7490. This is a critical level to maintain the upward trajectory in the medium-term after the index gave up two months of gains. An oversold RSI on the daily chart may attract some bargain hunters in this demand zone and short-covering would drive the bid up. 7750 is the first obstacle to lift and only a close back above 7900 would turn sentiment around.

