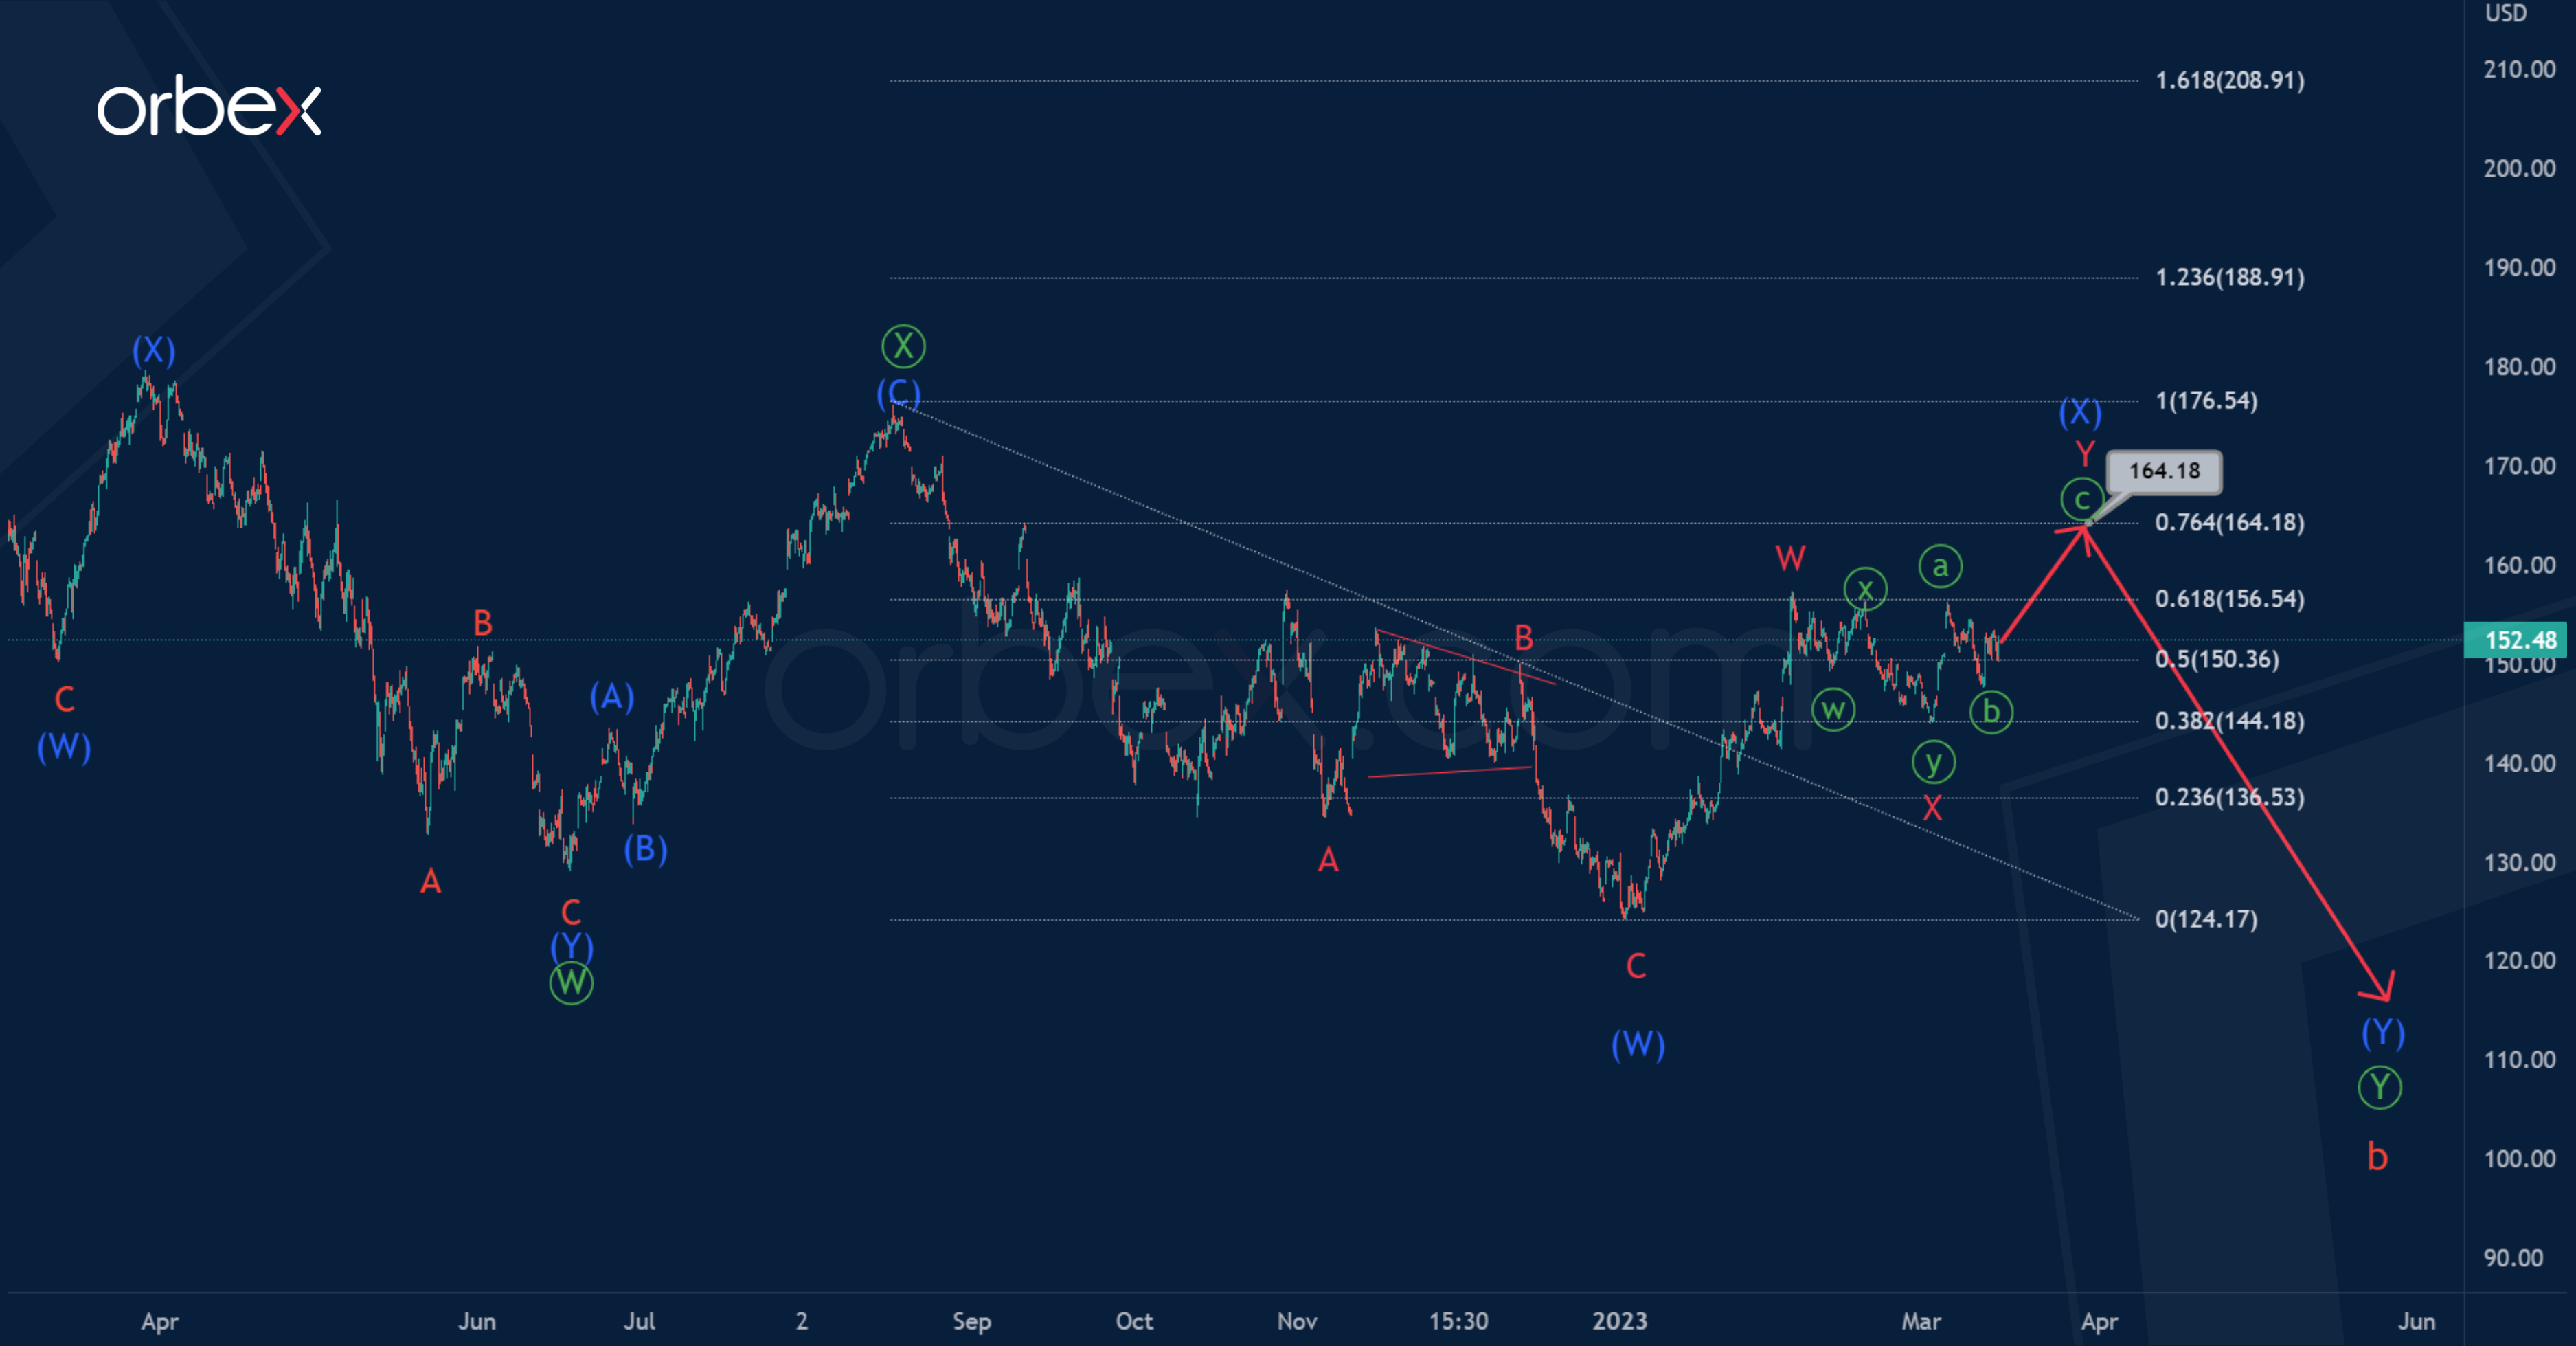
The current AAPL structure suggests the formation of a corrective pattern taking the form of a cycle zigzag a-b-c.
Most likely, a complex correction b is formed, taking the form of a primary double zigzag Ⓦ-Ⓧ-Ⓨ. The actionary leg Ⓦ and the zigzag intervening wave Ⓧ look completed, and the last sub-wave Ⓨ is still under development.
The wave Ⓨ is similar to the intermediate double zigzag (W)-(X)-(Y).

The price could soon rise to 164.16 and complete the intervening wave (X). At that level, it will be at 76.4% of actionary wave (W).
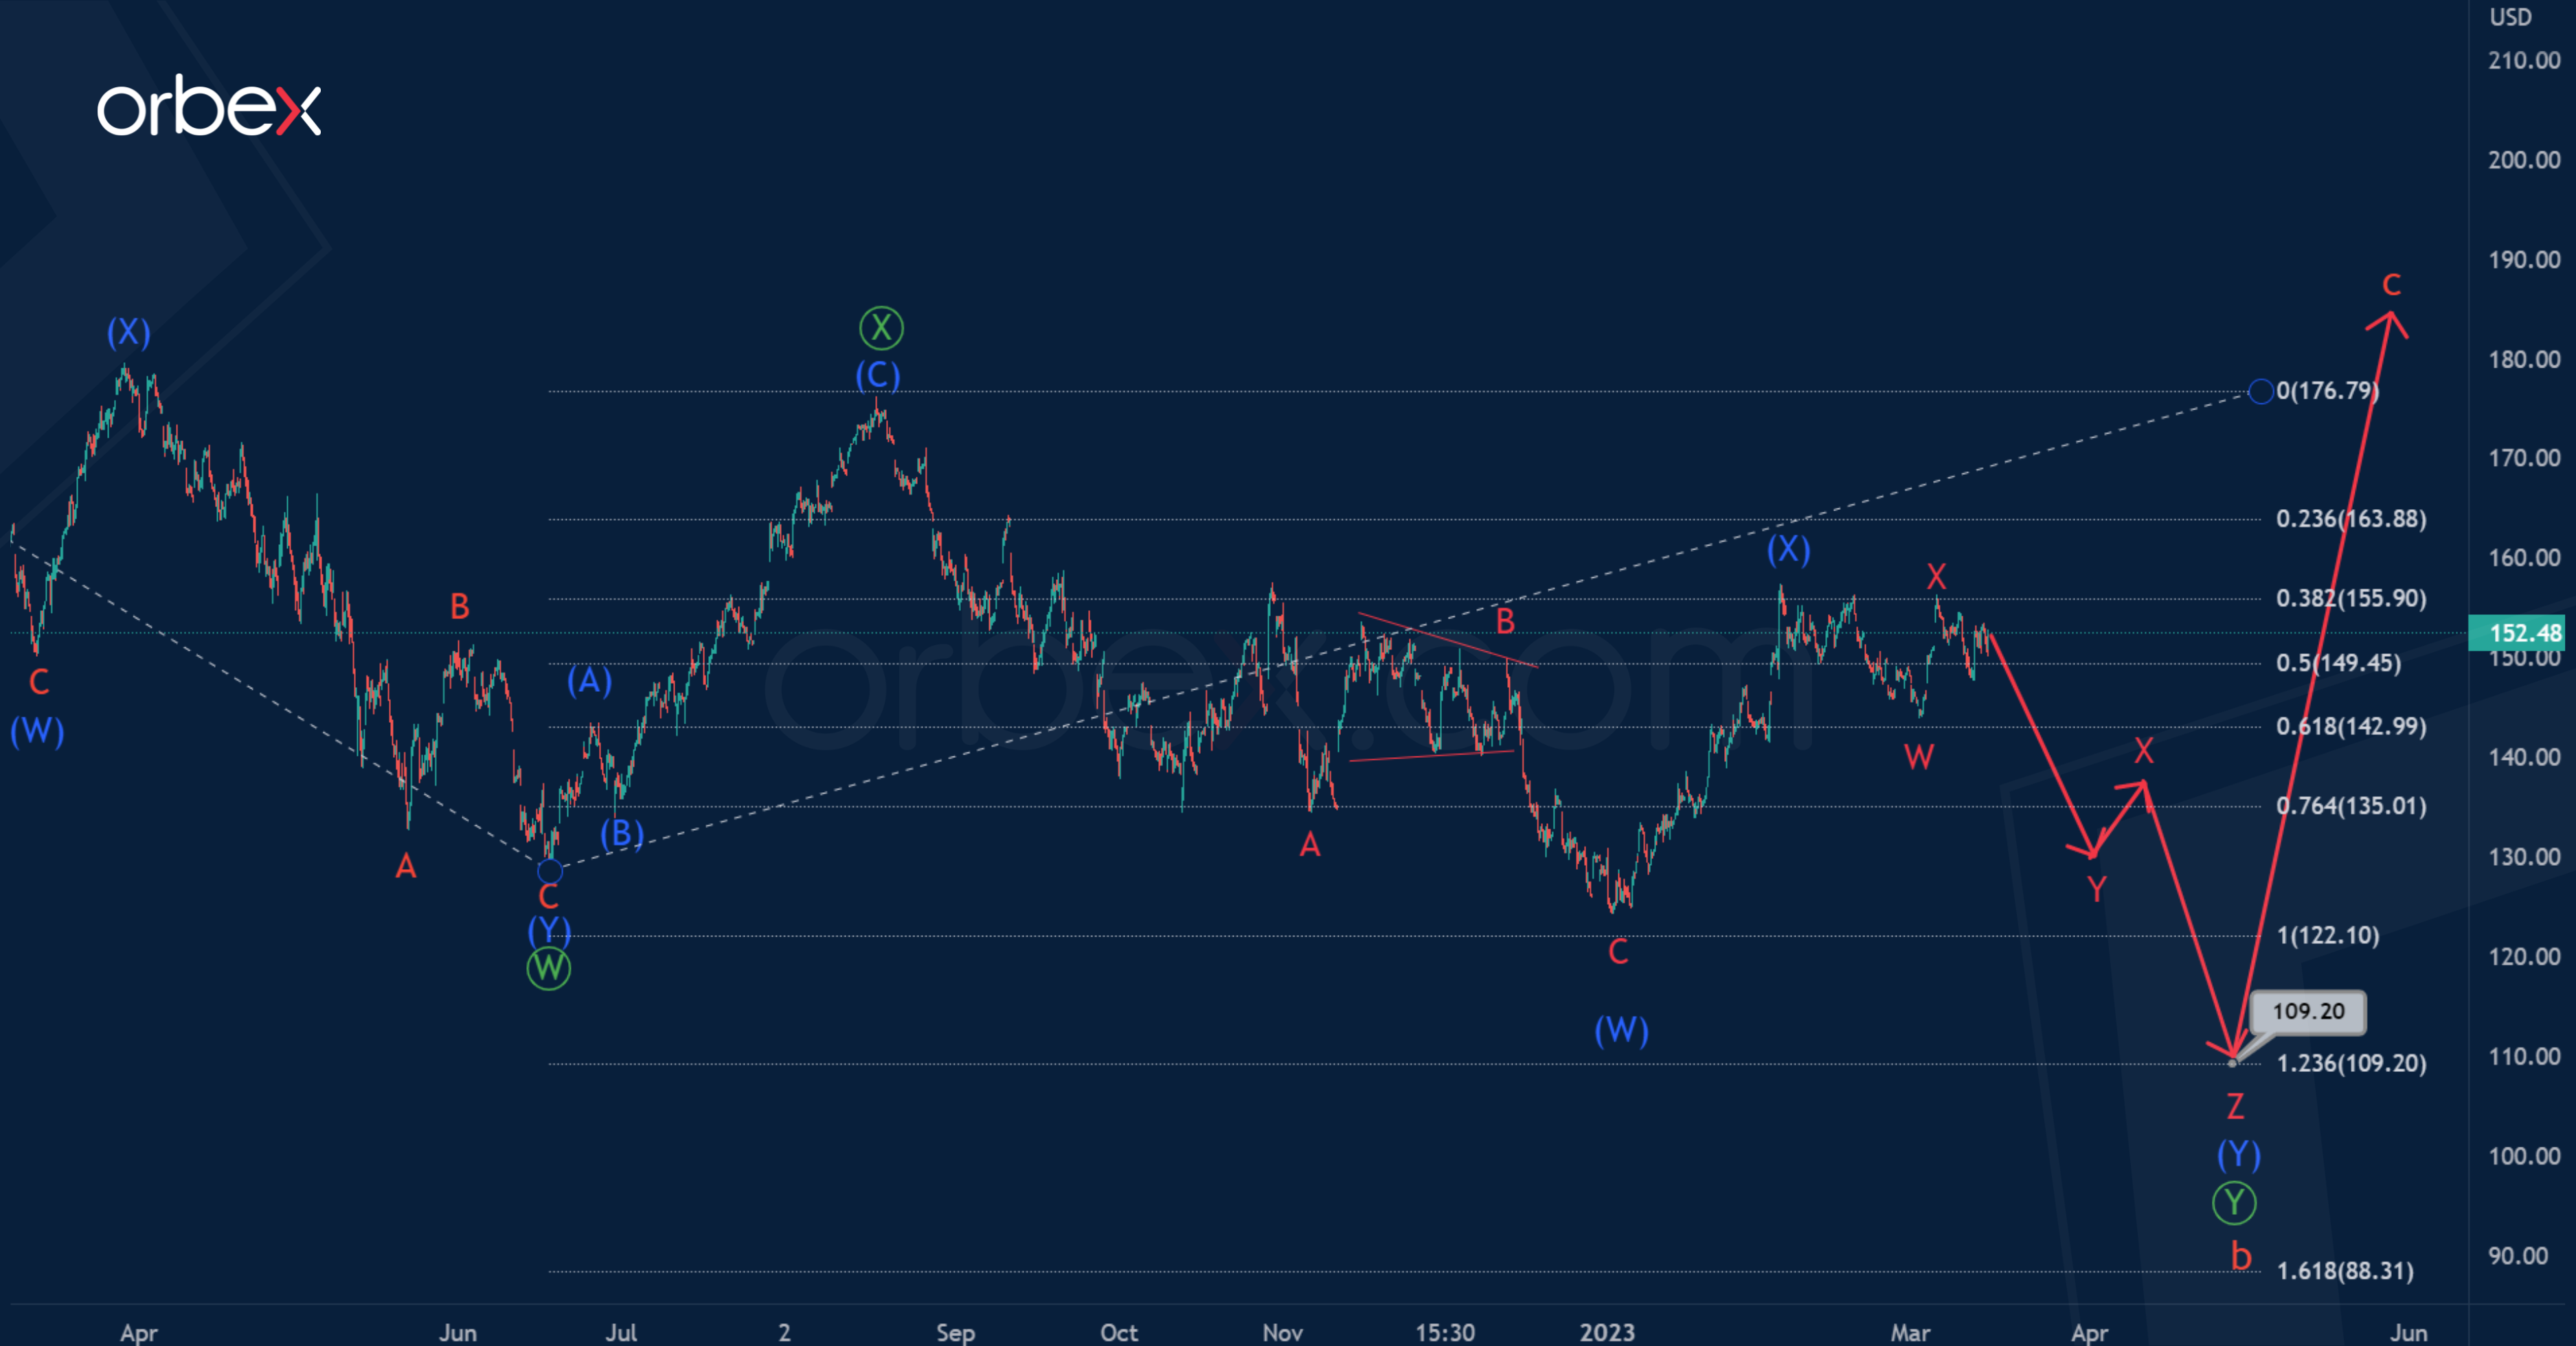
Let’s consider an alternative scenario in which waves (W) and (X) have ended.
It is possible that the market is now in the last sub-wave (Y). Perhaps it will be a minor triple zigzag, as shown in the chart.
The price in the specified wave (Y) could fall to 109.20. At that level, wave Ⓨ will be at 123.6% of Ⓦ.

![Credit Card 160×600 [EN]](https://assets.iorbex.com/blog/wp-content/uploads/2023/06/13144507/Blog-Banner_EN-Banner_160X600X2.webp)