
USDCHF bounces back
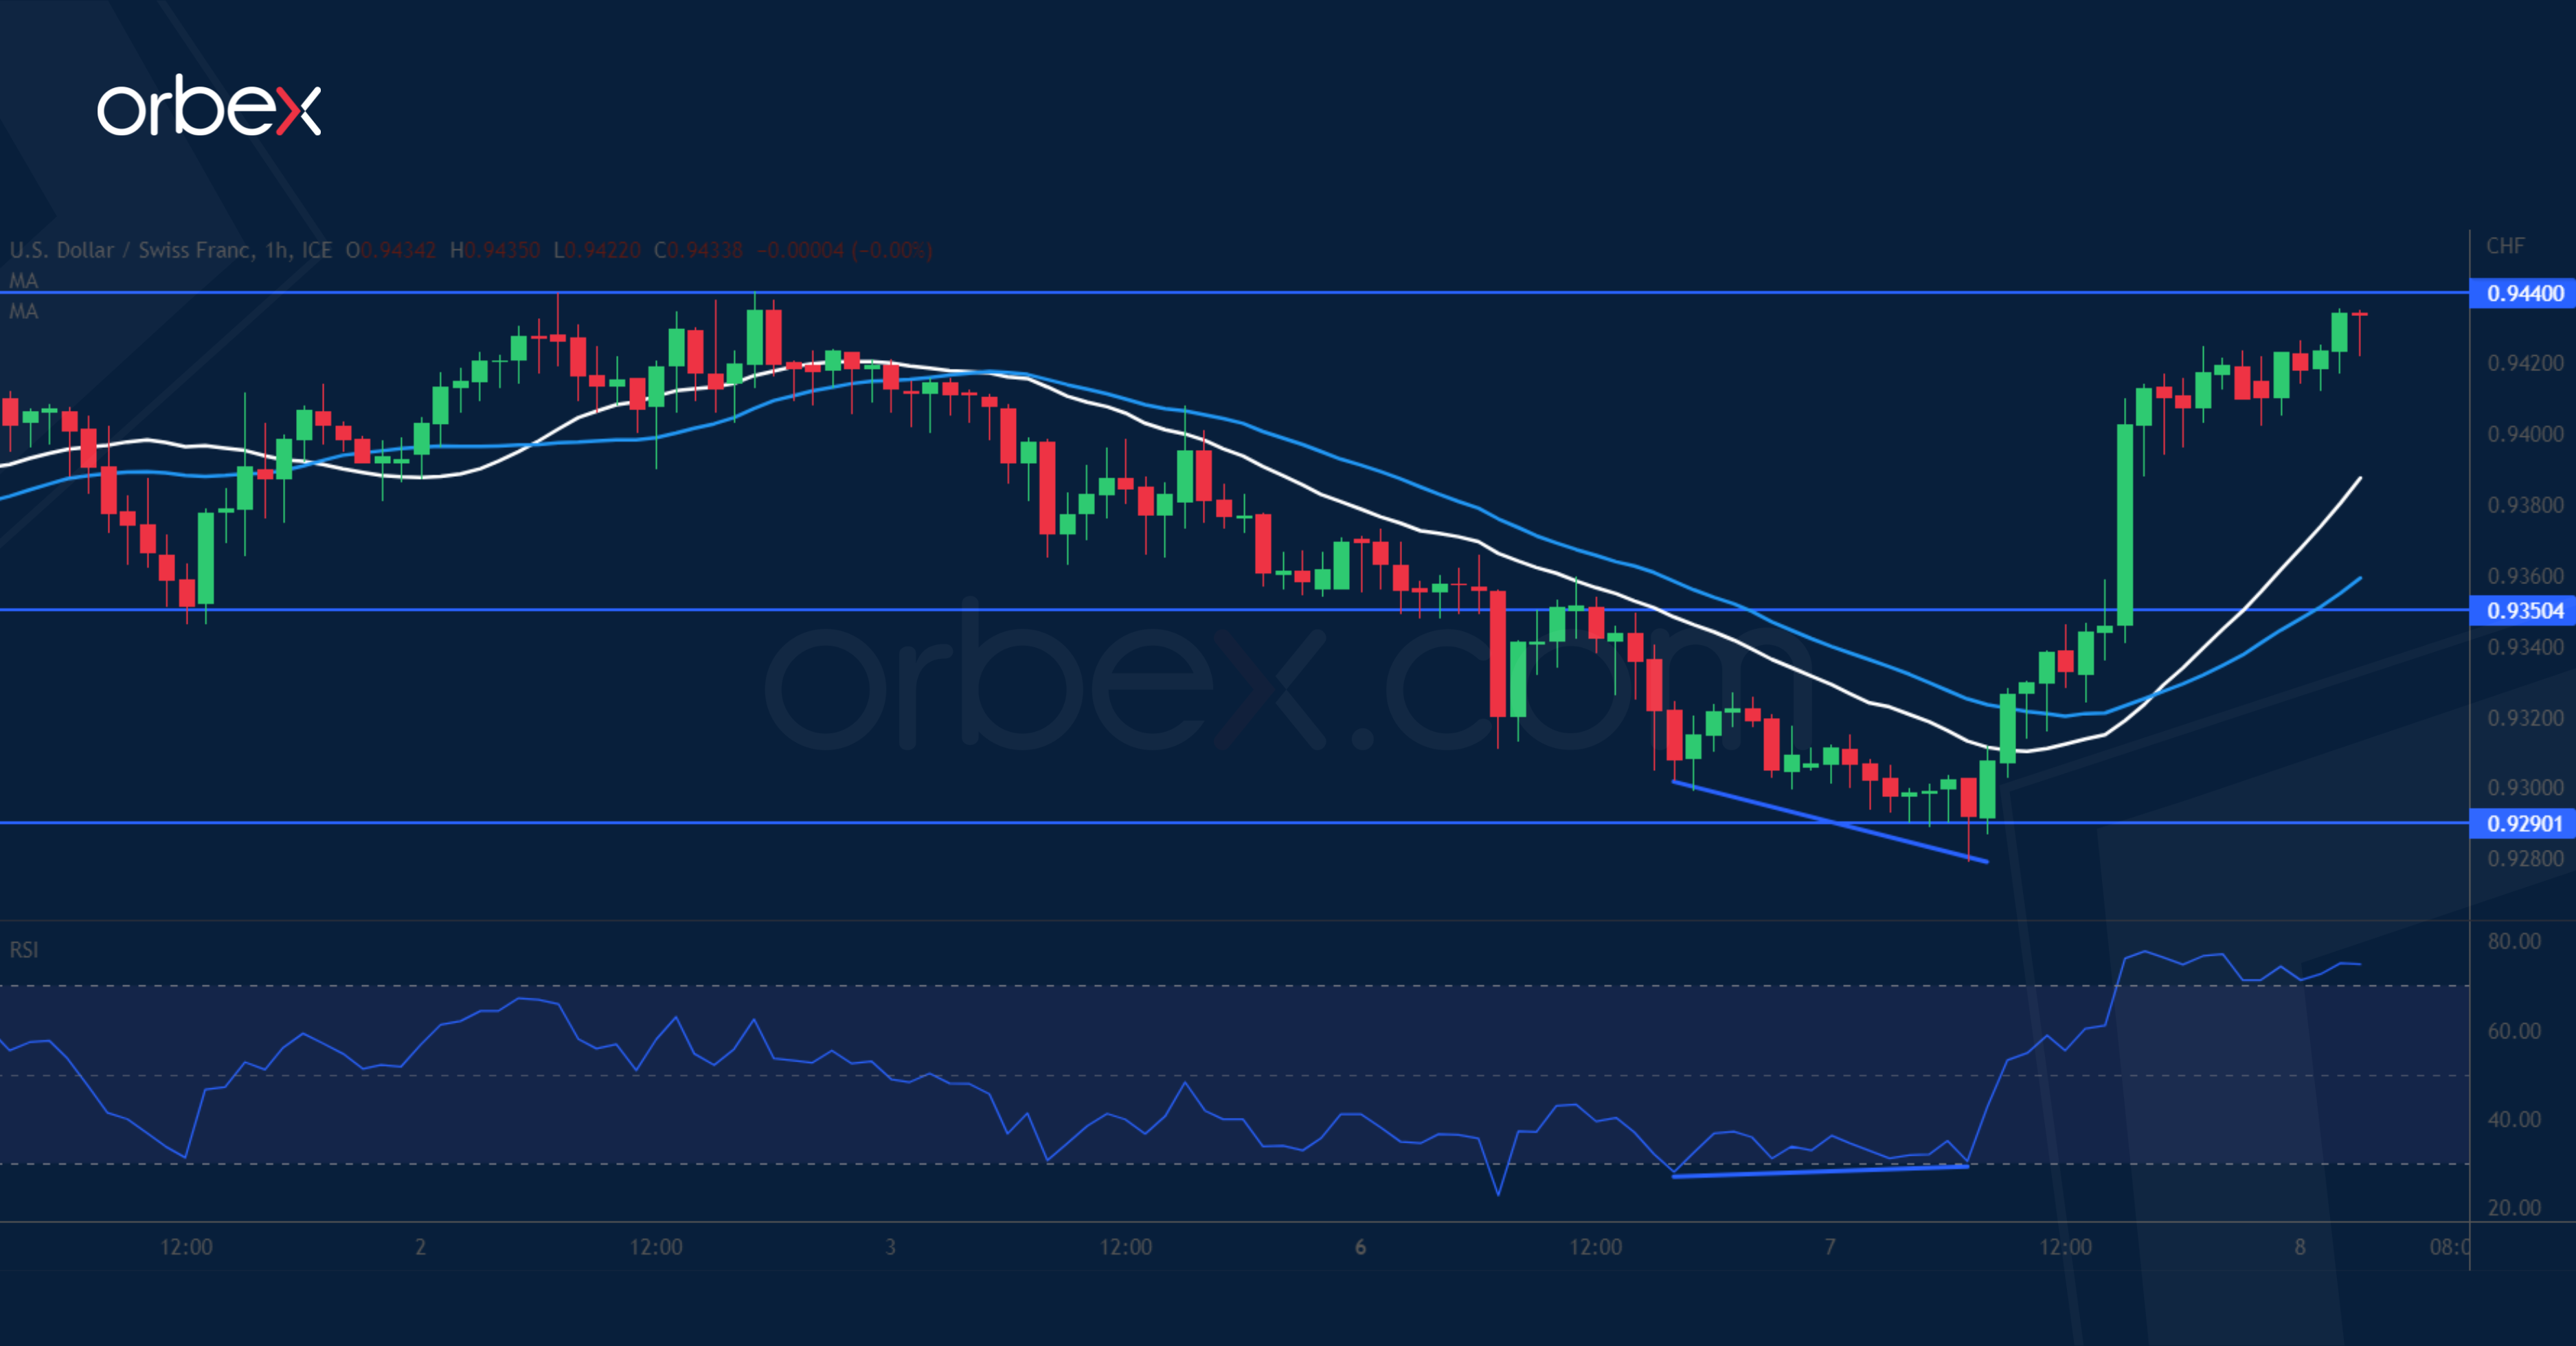
The US dollar popped after Fed Chair Jerome Powell hinted at a return to larger rate increases.

On the daily chart, after pulling back from its three-month high at 0.9440, the greenback found support over the 20-day SMA (0.9290), which coincides with the base of a previous bullish breakout. A bullish RSI divergence in this demand zone carries weight and the surge confirms the recovery. A break above 0.9400 puts the peak of 0.9440 under pressure and may resume the rally from early February. 0.9350 is now a fresh support.
AUDUSD breaks critical floor
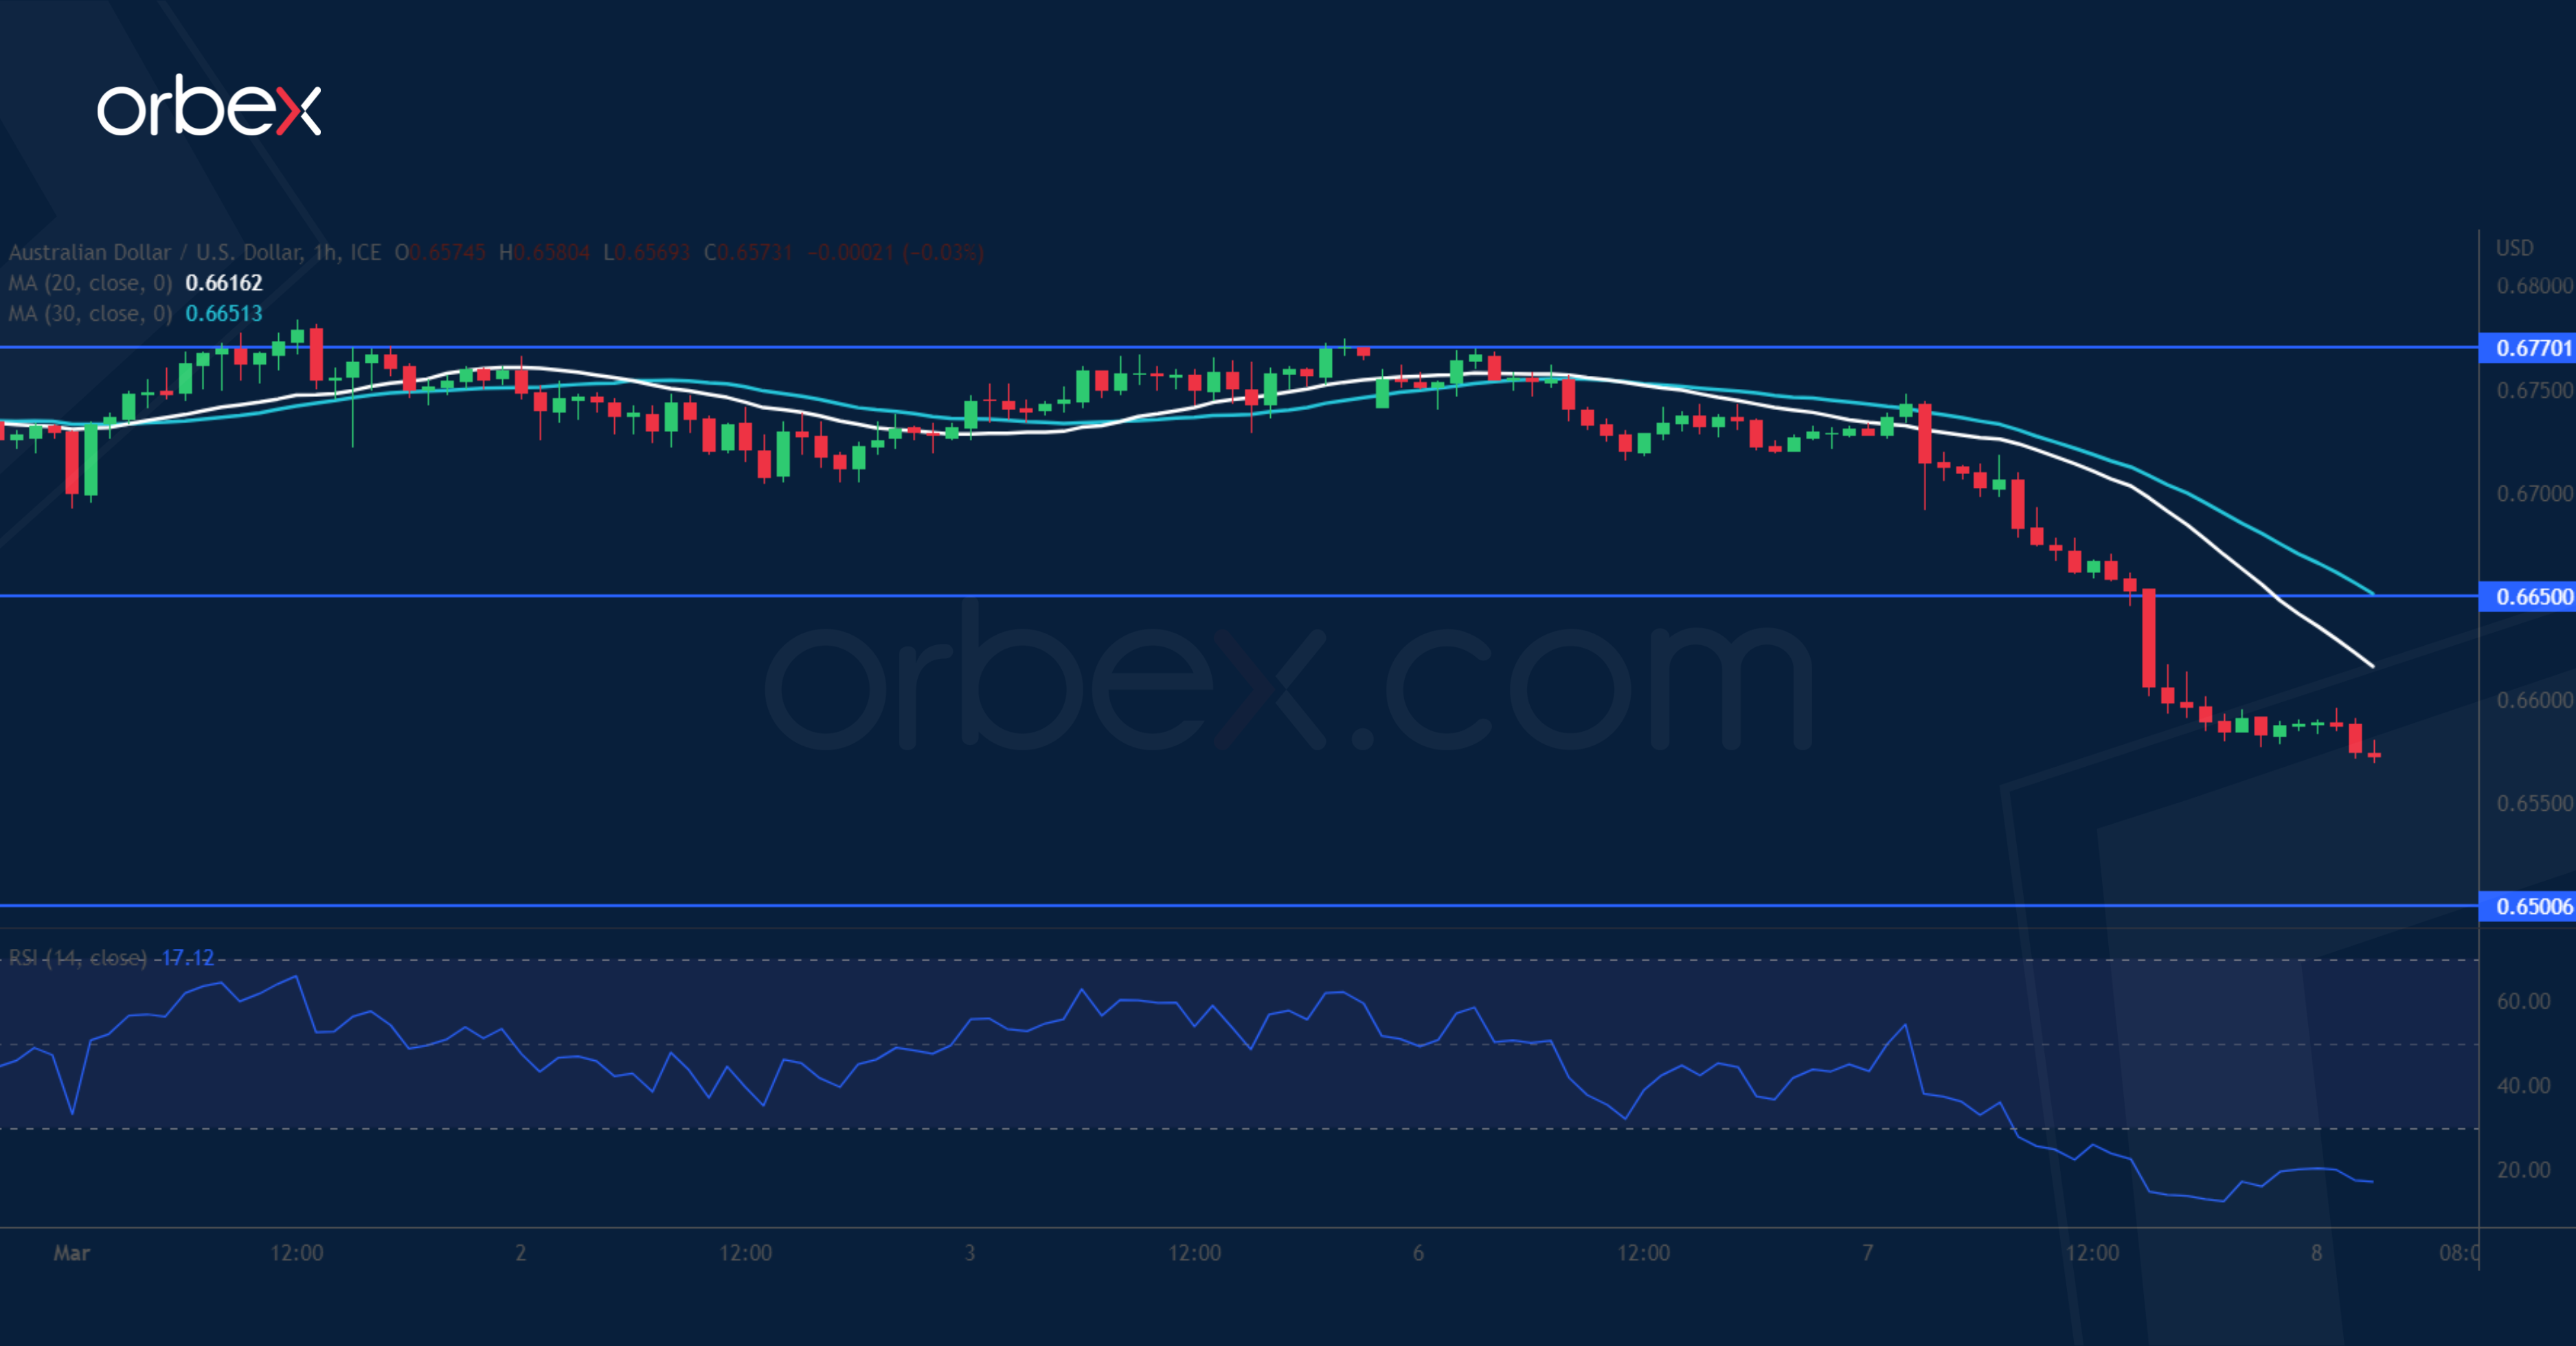
The Australian dollar slid after the RBA signalled it was near the conclusion of its tightening cycle. The pair pierced December’s lows around 0.6650 and opened the door for a liquidation towards 0.6500. In the medium-term, the correction could threaten the rebound from last October and turn it into a reversal. As the RSI dipped into oversold territory, profit-taking may trigger a limited bounce. 0.6650 has become a resistance and 0.6770 at the top of the recent consolidation may see more bears selling into strength.
UK 100 turns south

Equities tumbled after Powell’s hawkish comments turned markets risk-off. On the daily chart, the FTSE 100 has remained upbeat while grinding along the 30-day SMA, a sign that the bulls are still eager to keep the ride going. Buying pressure has been building up after the price secured a foothold over 7850, but the latest fall below 7895 dented the short-term mood. 7850 is a key level to keep the week-long bounce intact as its breach could trigger a broader sell-off towards the daily support of 7710. 7960 is the closest resistance.

