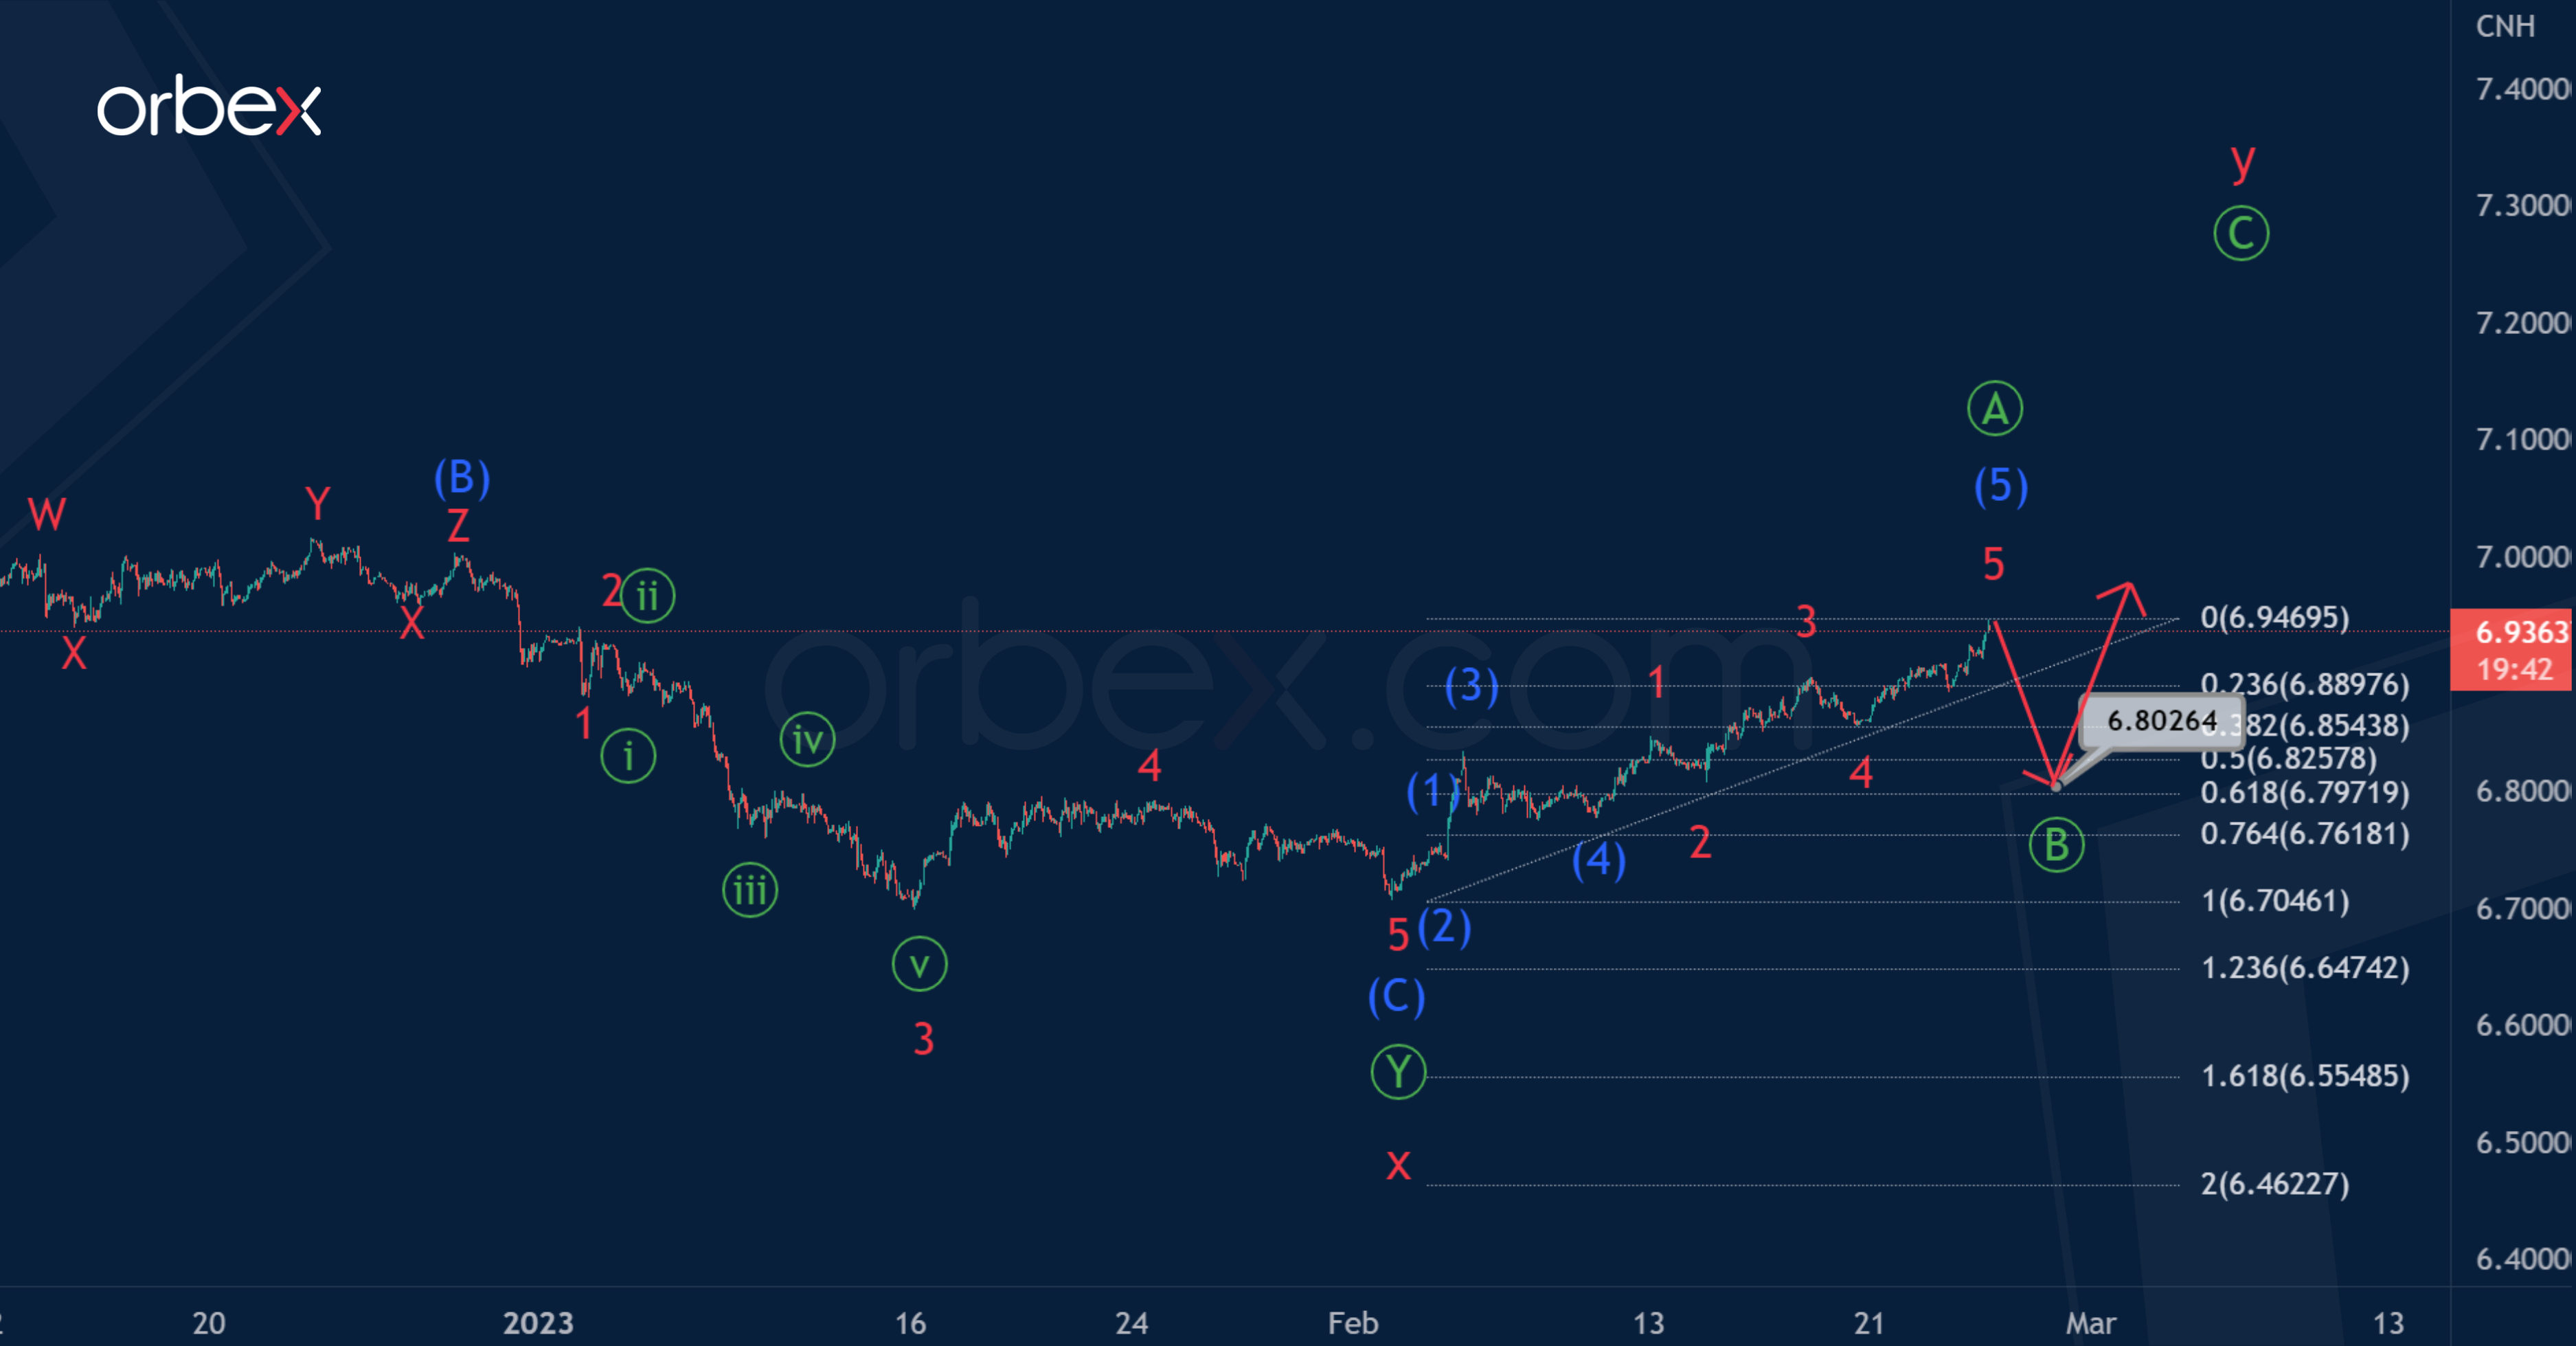
USDCNH seems to be forming a double zigzag w-x-y of a cycle degree. By the beginning of this month, the bearish intervening wave x has ended. This looks like a primary double zigzag Ⓦ-Ⓧ-Ⓨ.
It is assumed that in the last section of the chart, the actionary wave Y is being constructed. Perhaps it will take the form of a standard zigzag Ⓐ-Ⓑ-Ⓒ.
The primary impulse wave Ⓐ could come to an end. In the near futur,e the price could be adjusted in wave Ⓑ. Its finale is expected near 6.802. At that level, it will be at 50% of impulse Ⓐ.

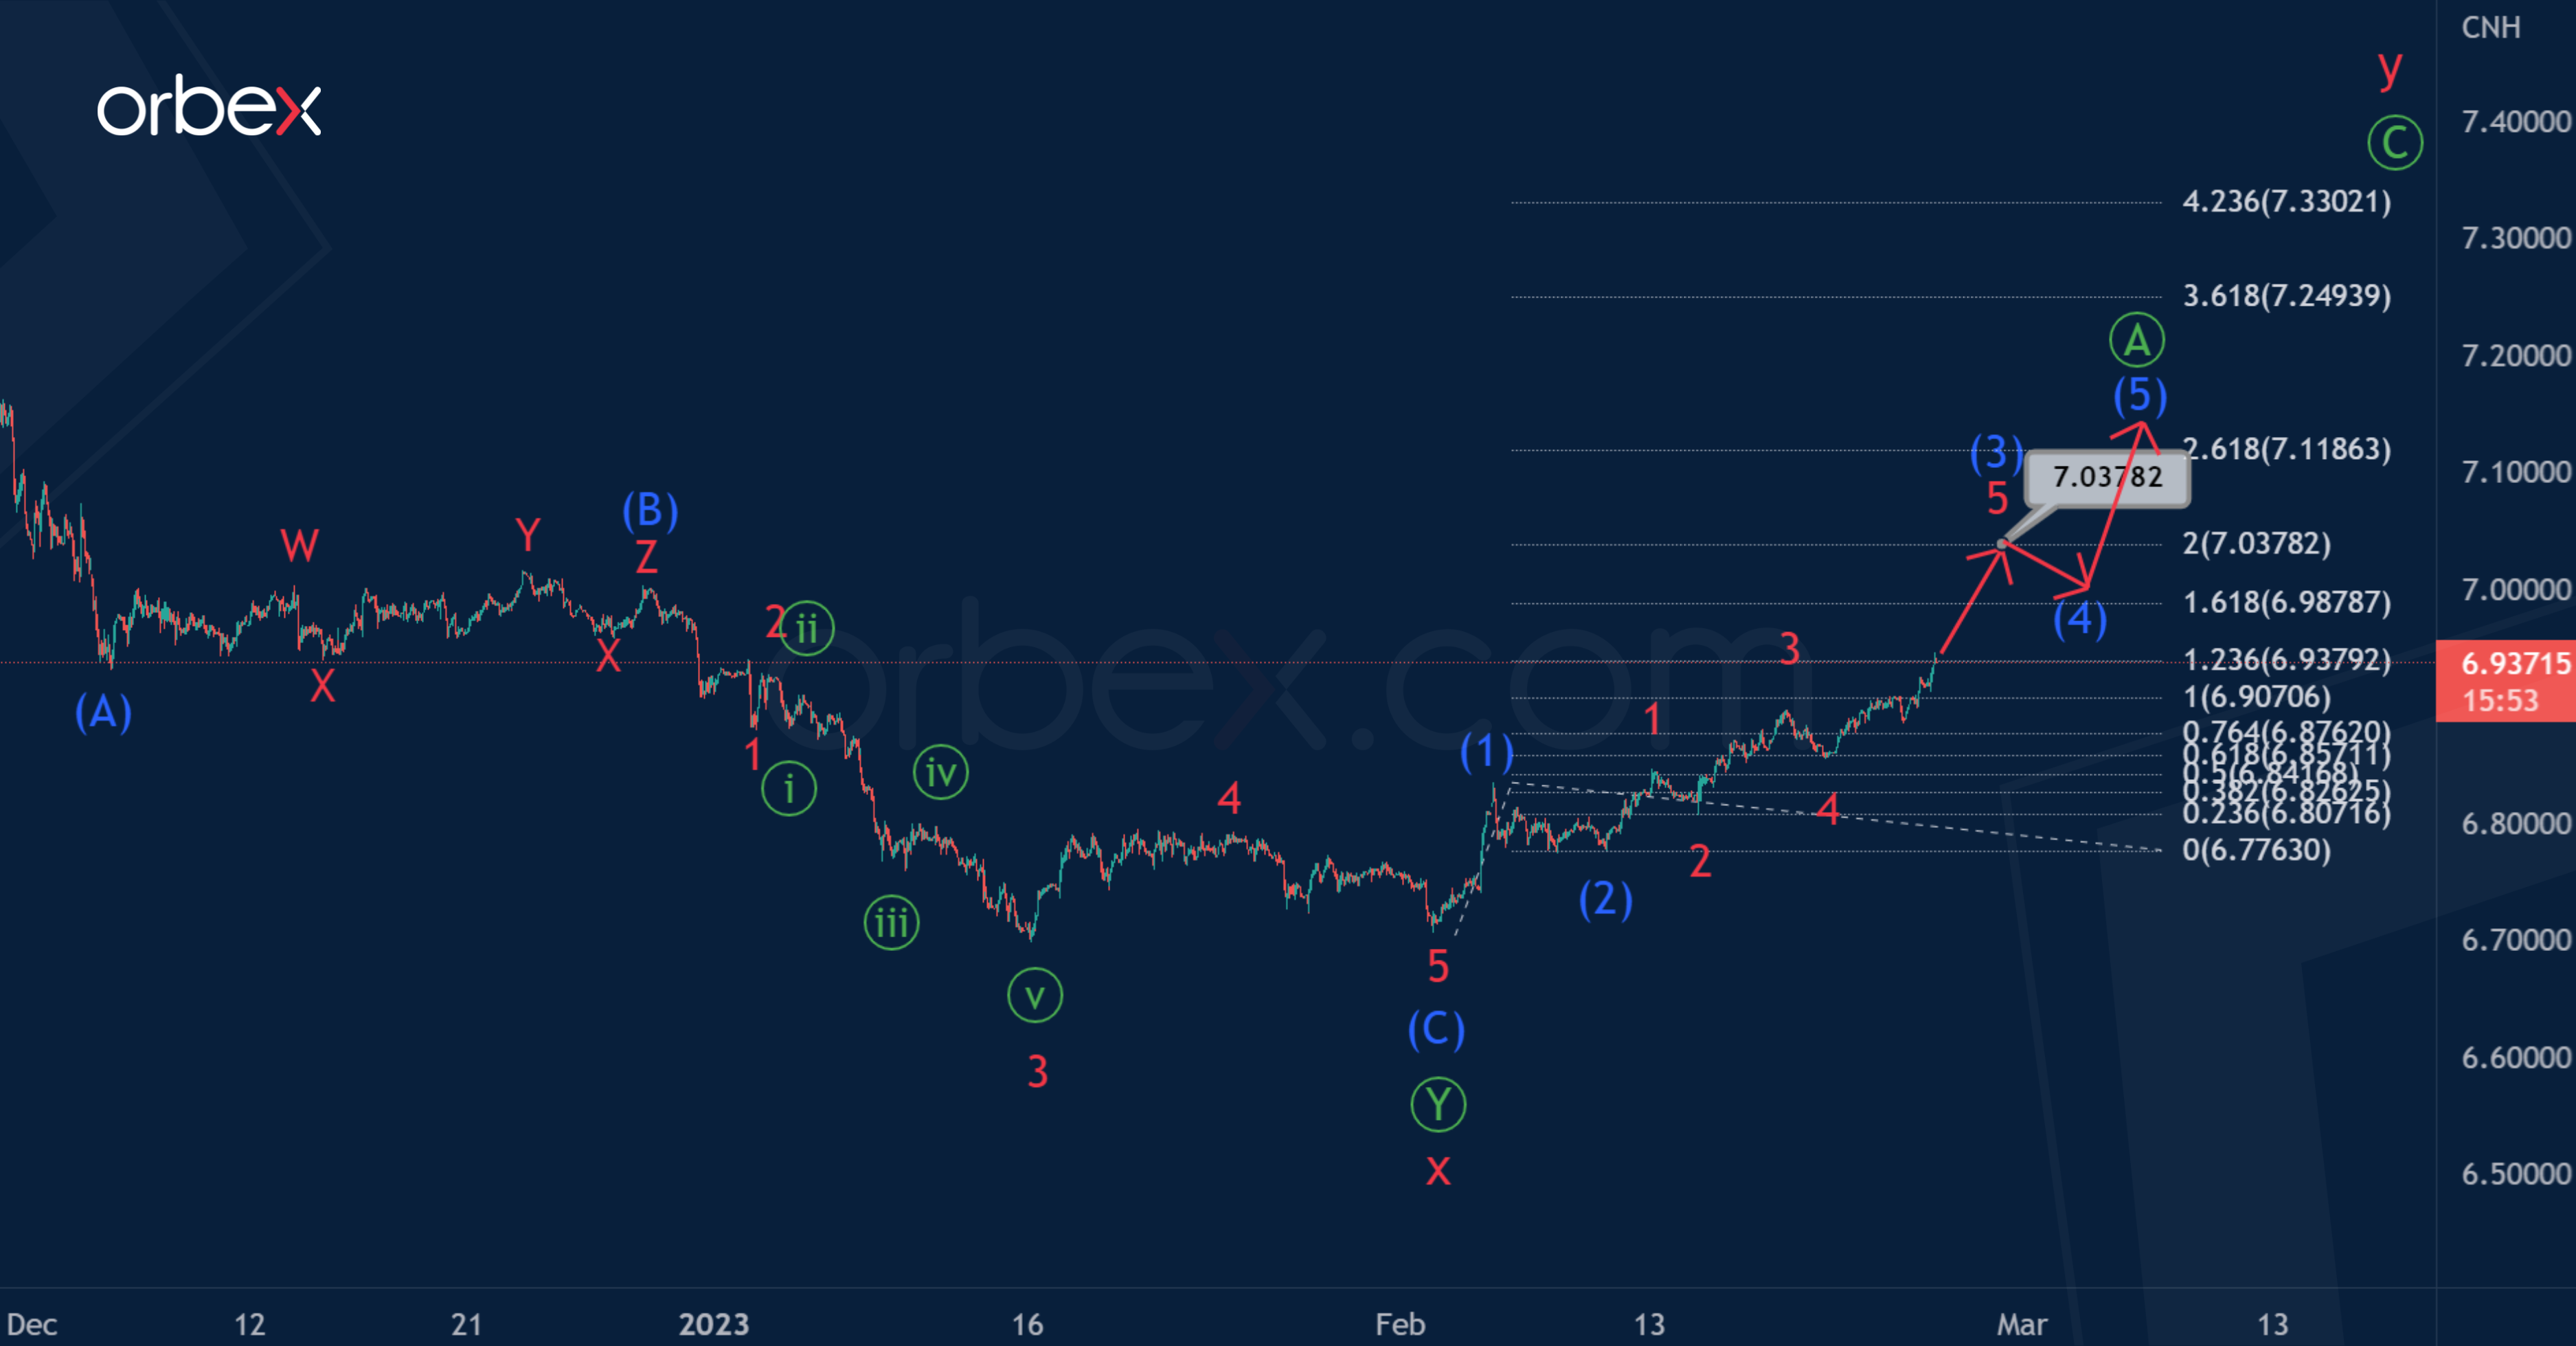
In the second option, the price can continue increasing in the primary impulse wave Ⓐ.
It is possible that at the moment only two intermediate sub-waves (1)-(2) have ended in the impulse Ⓐ. In the near future, the price could rise in impulse (3) to 7.037. At that level, it will be at the 200% Fibonacci extension of impulse (1).
An approximate scheme of possible future movement is shown on the chart.

