
EURUSD drifts lower
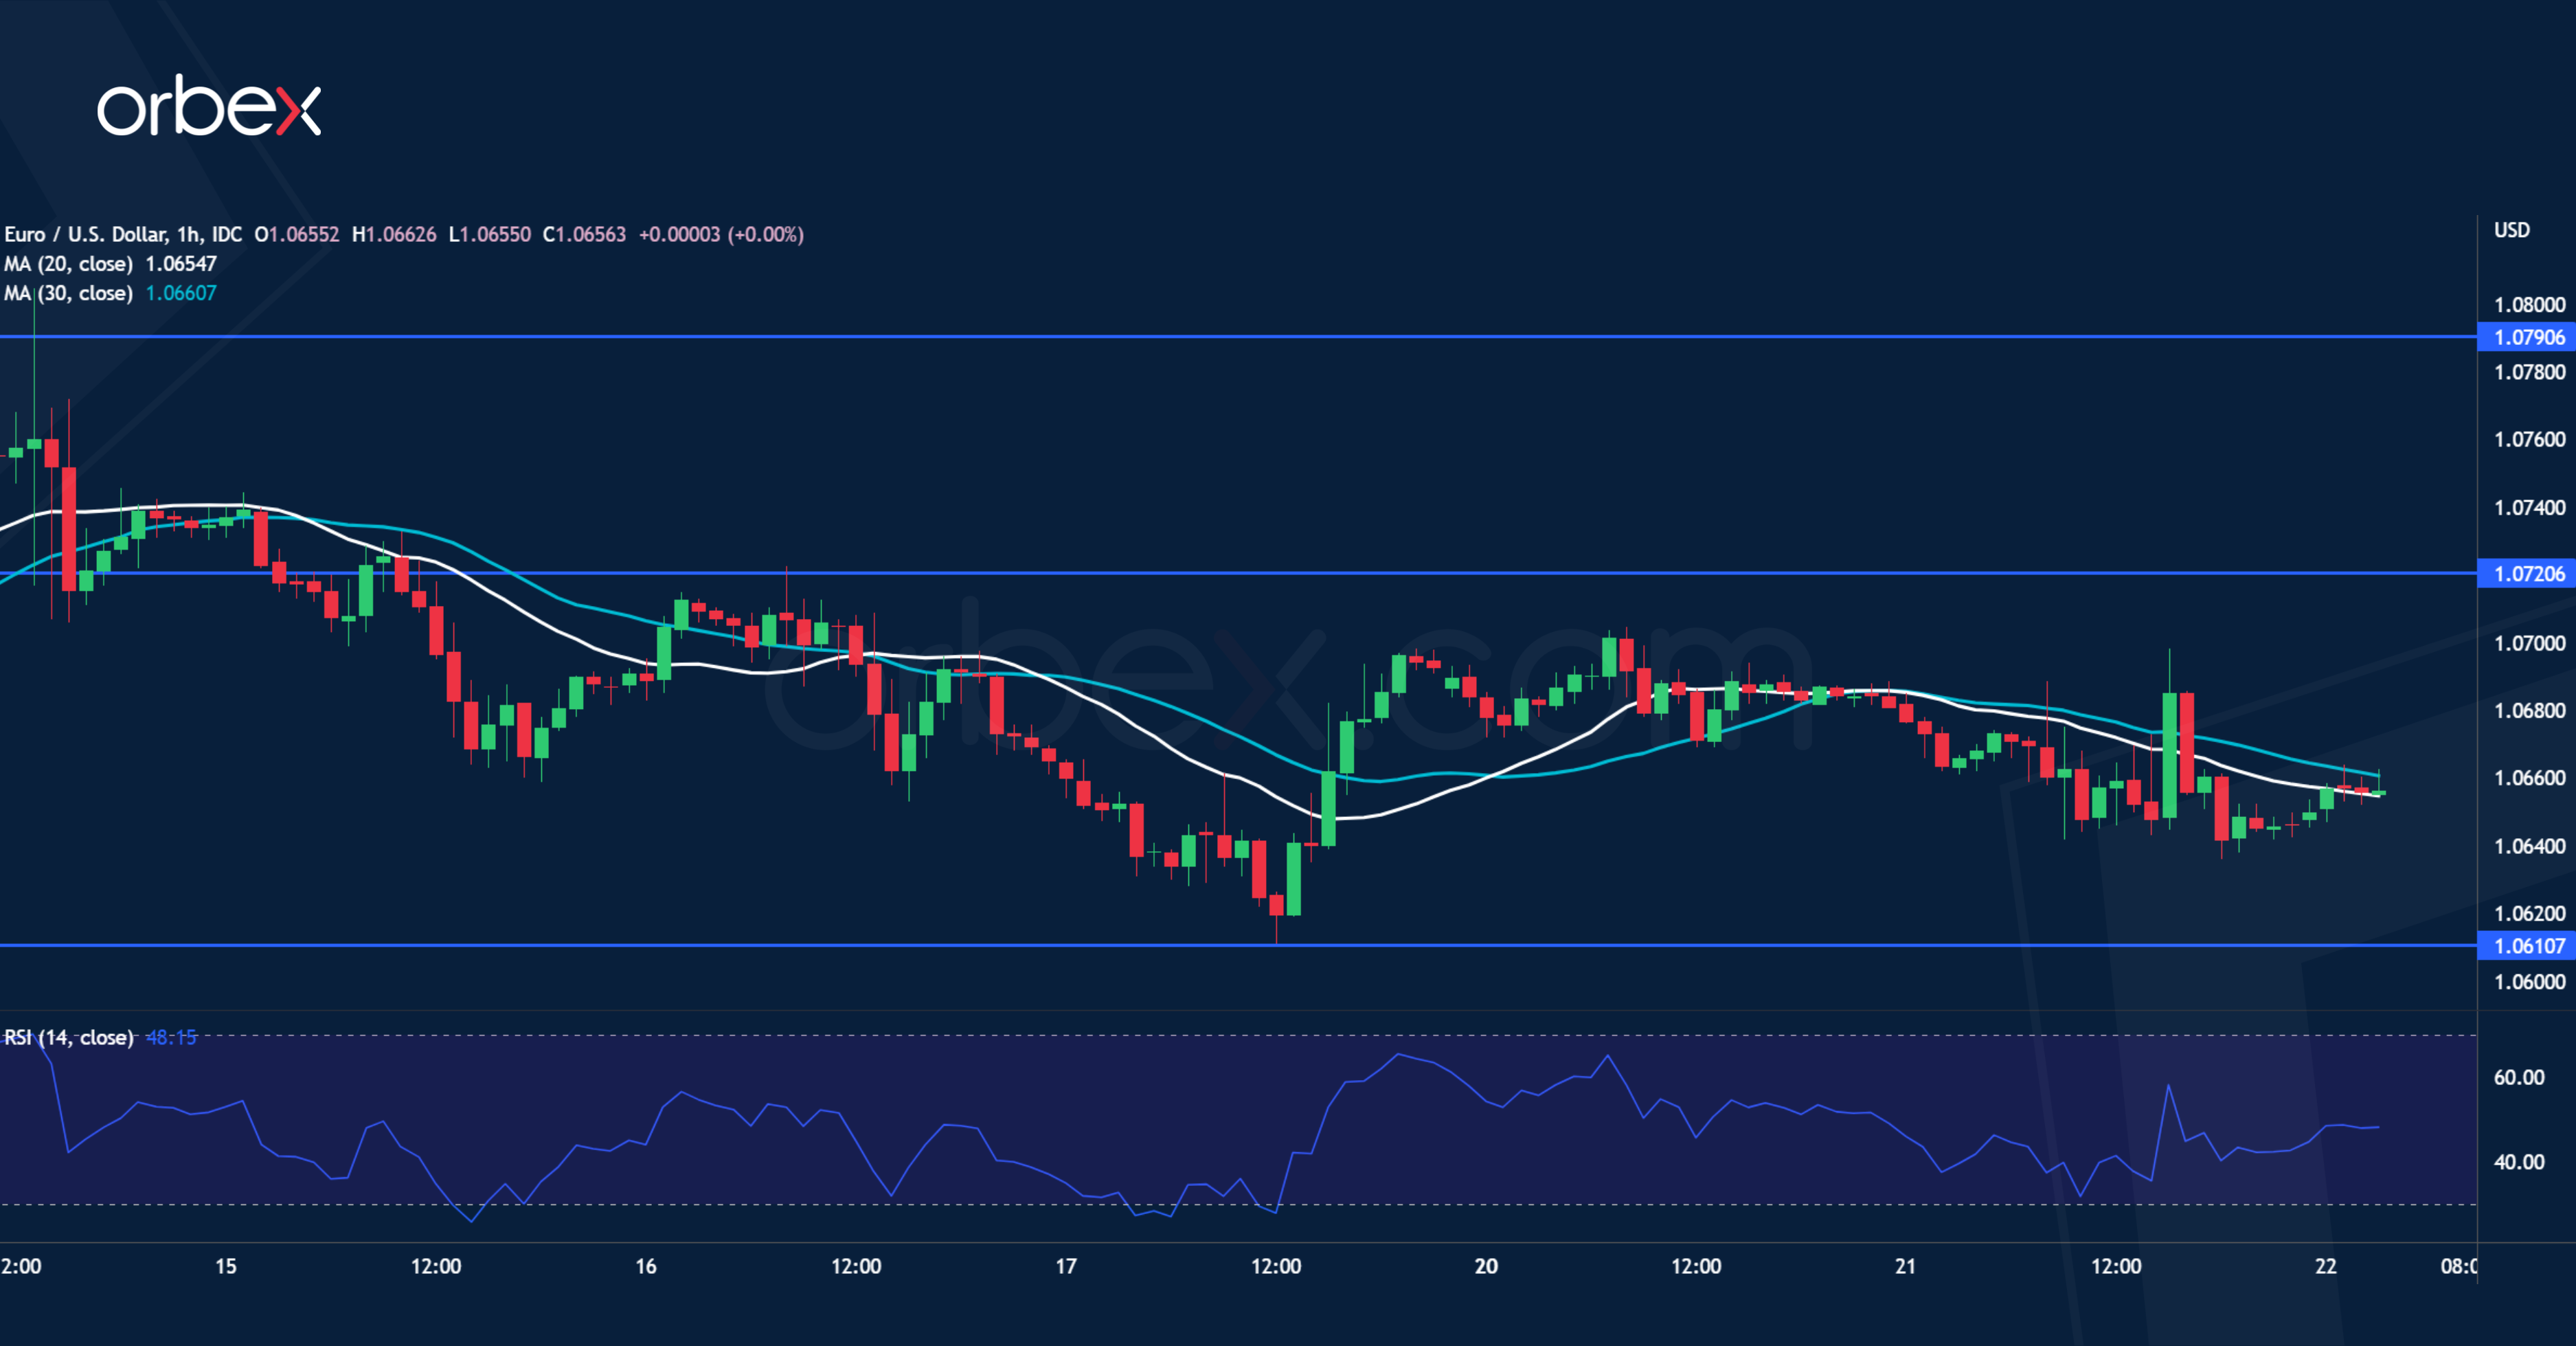
The US dollar extended gains helped by upbeat PMIs in February. On the daily chart, a bearish MA cross after the price pierced the moving averages suggests that a correction is due after a three-month long rally. The pair is grinding the demand zone around 1.0610 from last January’s bullish breakout. 1.0720 is the closest hurdle and only a clean break above 1.0790, a twice-tested resistance, would turn short-term sentiment around. Failing that, the single currency could sink towards the critical floor at 1.0500.
USDCAD bounces higher

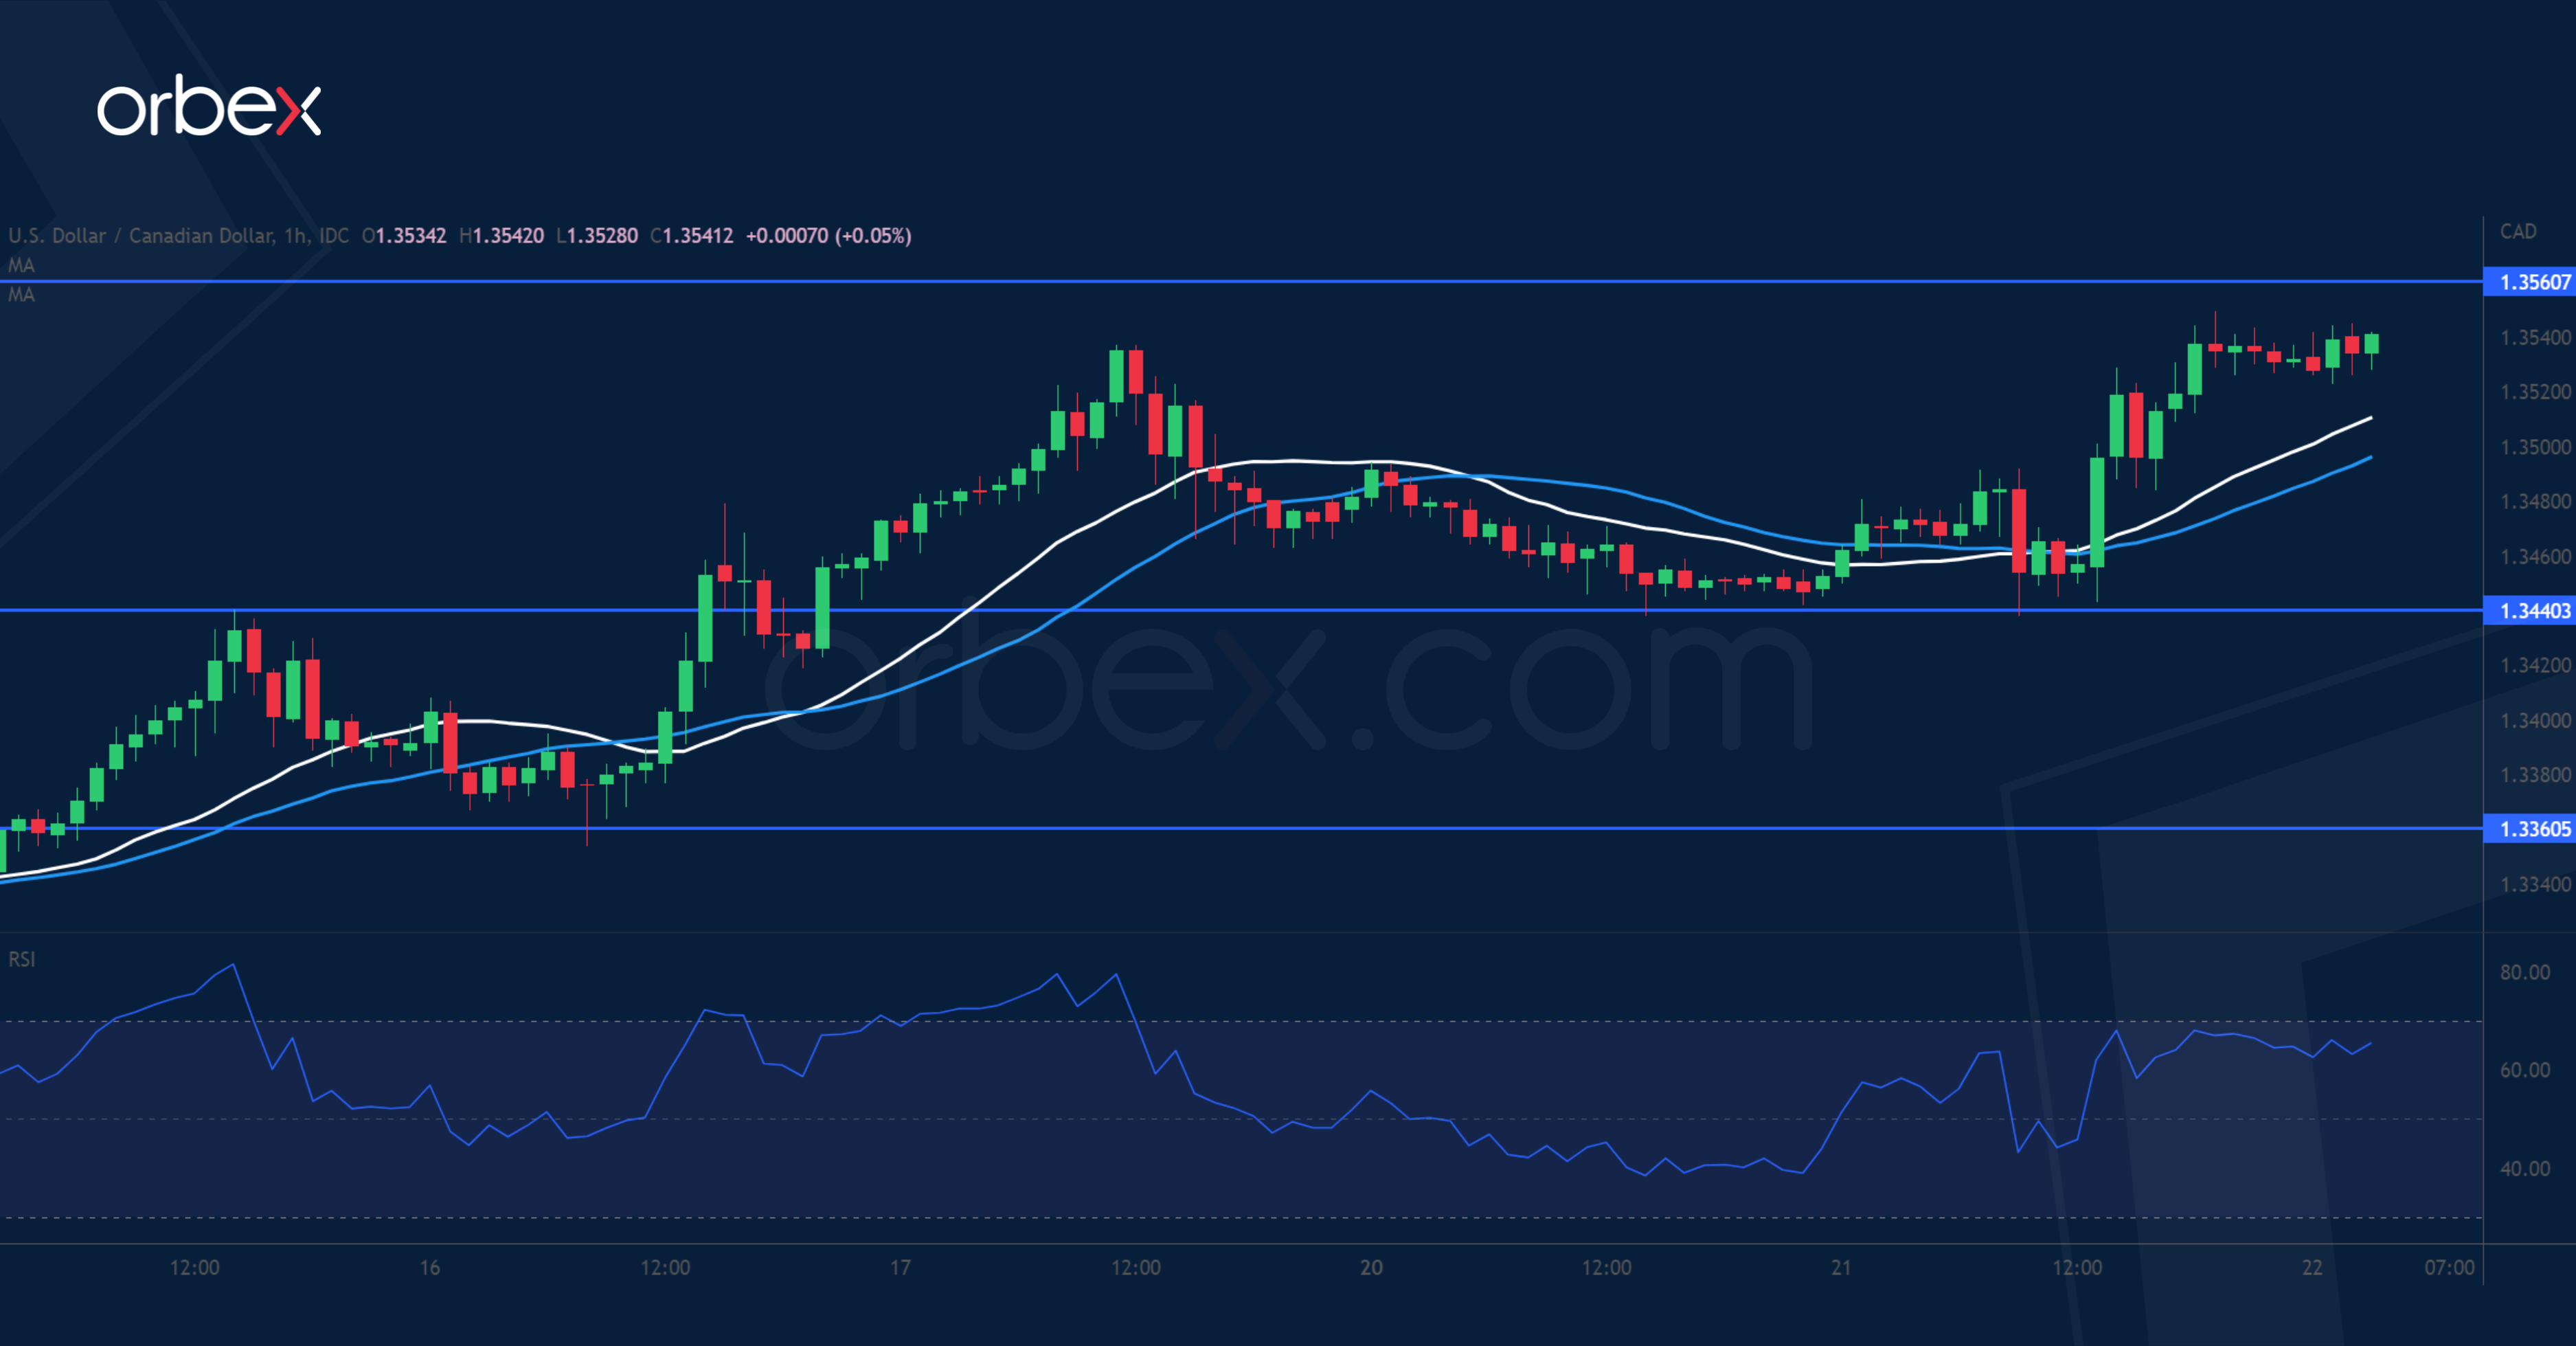
The Canadian dollar tanked as easing inflation may keep the BoC at bay. A break above the supply zone 1.3470-1.3510 has helped the bulls regain control of the direction. A series of higher highs is a sign of mounting buying pressure and so far buyers have seen pullbacks as opportunities to stake in. 1.3440 is a fresh support and 1.3360 is an important level to keep the upward bias intact. Some resistance could be felt near the previously failed support at 1.3560 before the rally could extend to the daily resistance of 1.3660.
UK 100 consolidates
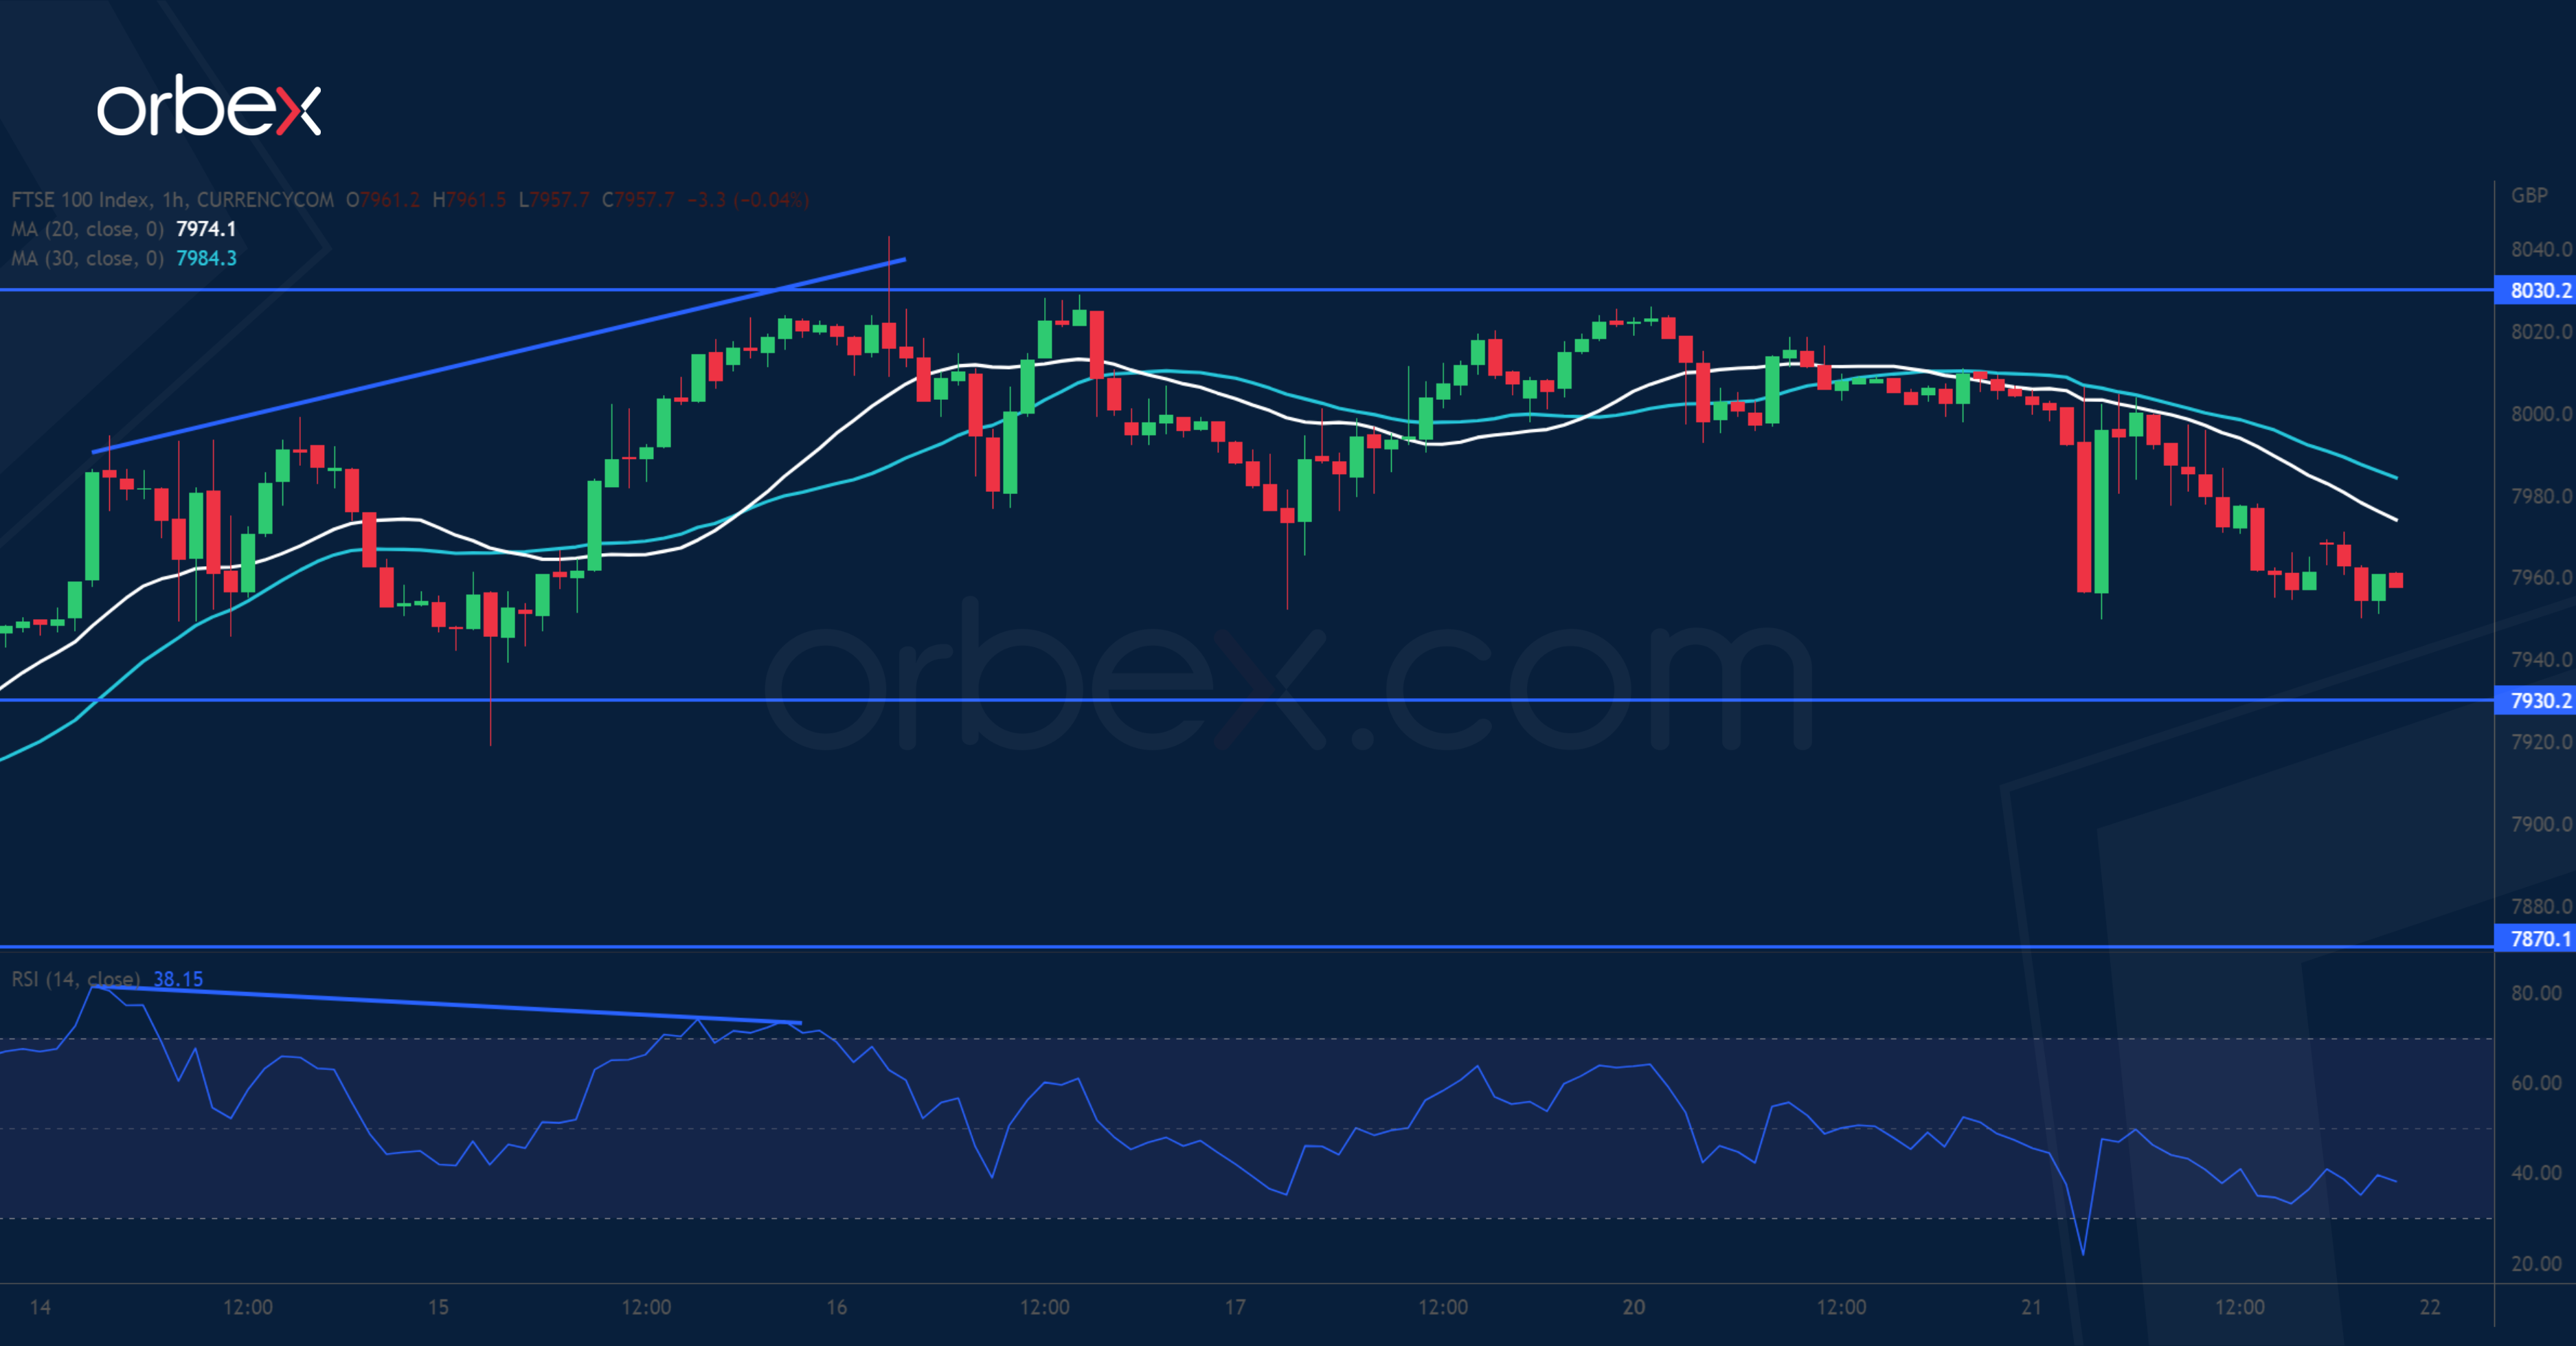
The FTSE 100 turns lower on fears of more rate hikes by the BoE. On the daily chart, the RSI’s overbought condition indicates overextension though there is no confirmation of a fallback yet. A bearish RSI divergence on the hourly chart shows a deceleration. 7930 is the immediate support and its beach may corroborate the observation in these time frames. Then 7870 on the 30-day SMA would be a key level to gauge the strength of follow-up interests. On the upside, a close back above 8030 would resume the uptrend.

