
GBPUSD breaks lower
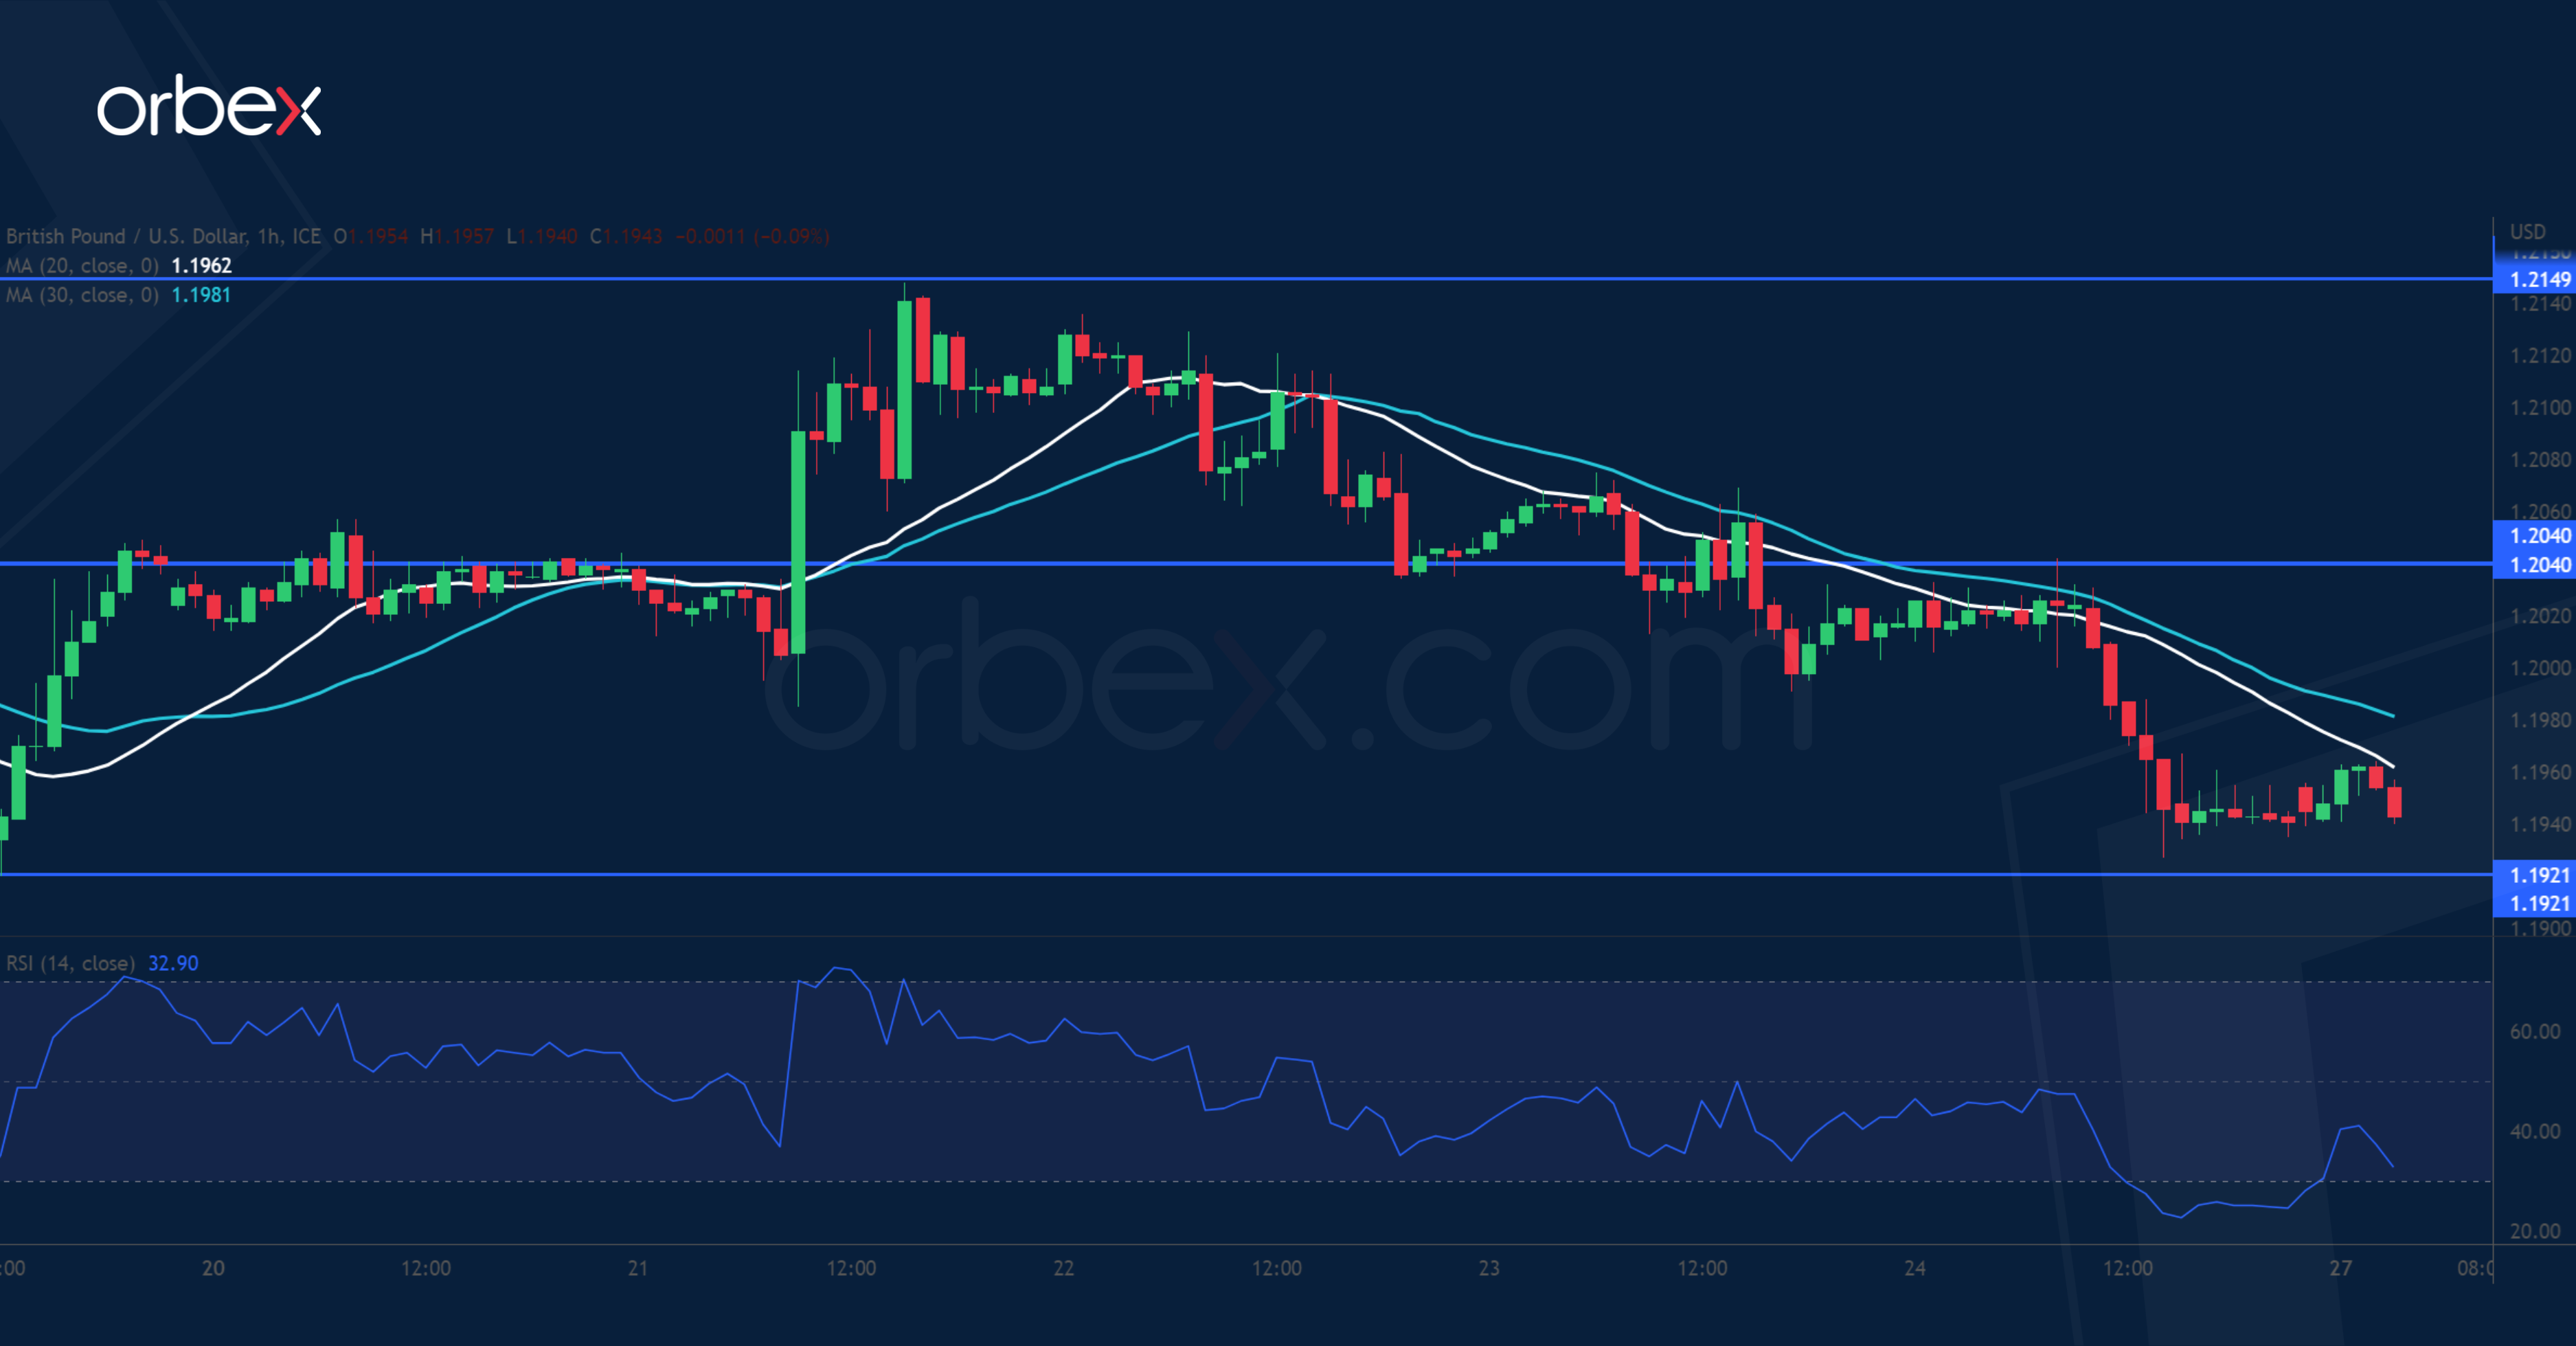
The US dollar climbed after the PCE accelerated in January. On the daily chart, the pair is still probing bids near January’s low of 1.1850. The latest bounce came to a halt in the supply zone 1.2150 from the sell-off in mid-February. Then a drop below the psychological level of 1.2000 at the base of a former bullish engulfing candle shows that the path of least resistance remains down. The recent swing low of 1.1920 is the next support and its breach would expose the critical floor at 1.1850. 1.2040 is the closest resistance.
EURJPY bounces back

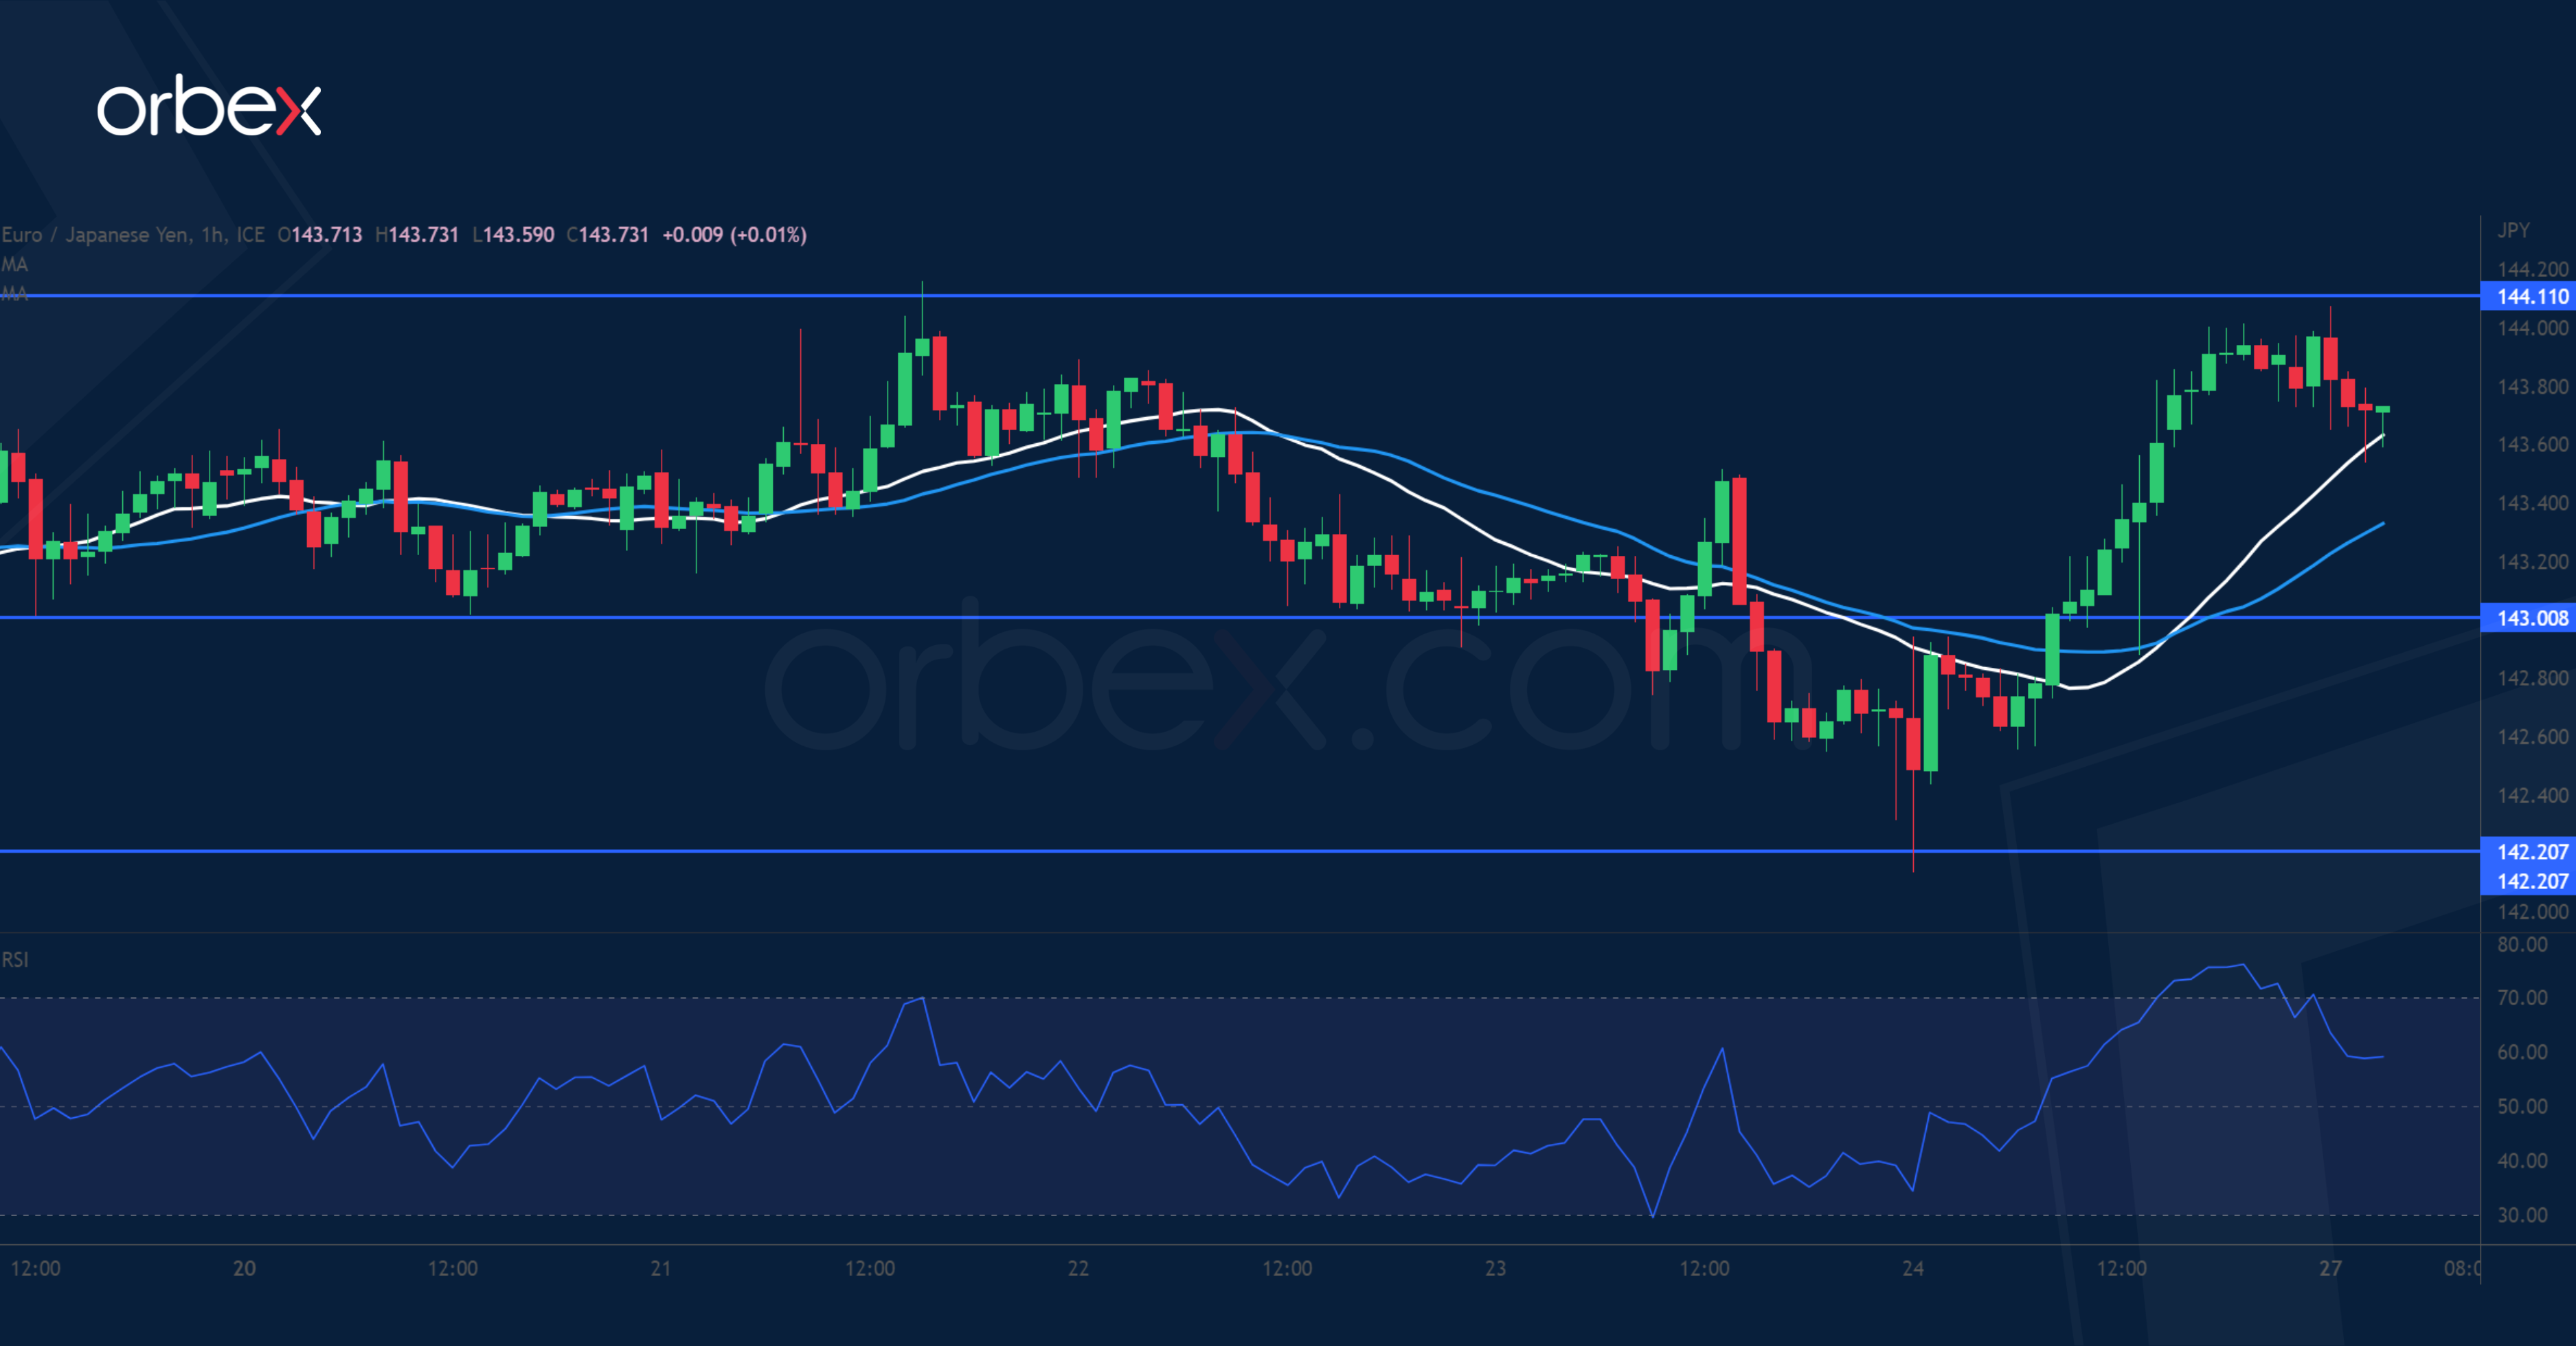
The Japanese yen fell after the BoJ governor nominee Kazuo Ueda said he may keep policy ultra-loose. The pair has previously met stiff selling pressure at 144.10 near the origin of the sharp December liquidation. But that did not deter the bulls as bids emerged on the 20-day SMA (142.20) which coincides with the base of a breakout rally in mid-February. This suggests that overall sentiment is still upbeat in the medium-term. 143.00 is a fresh support and a close above 144.10 would trigger a runaway rally towards 145.80.
US 30 tests critical support
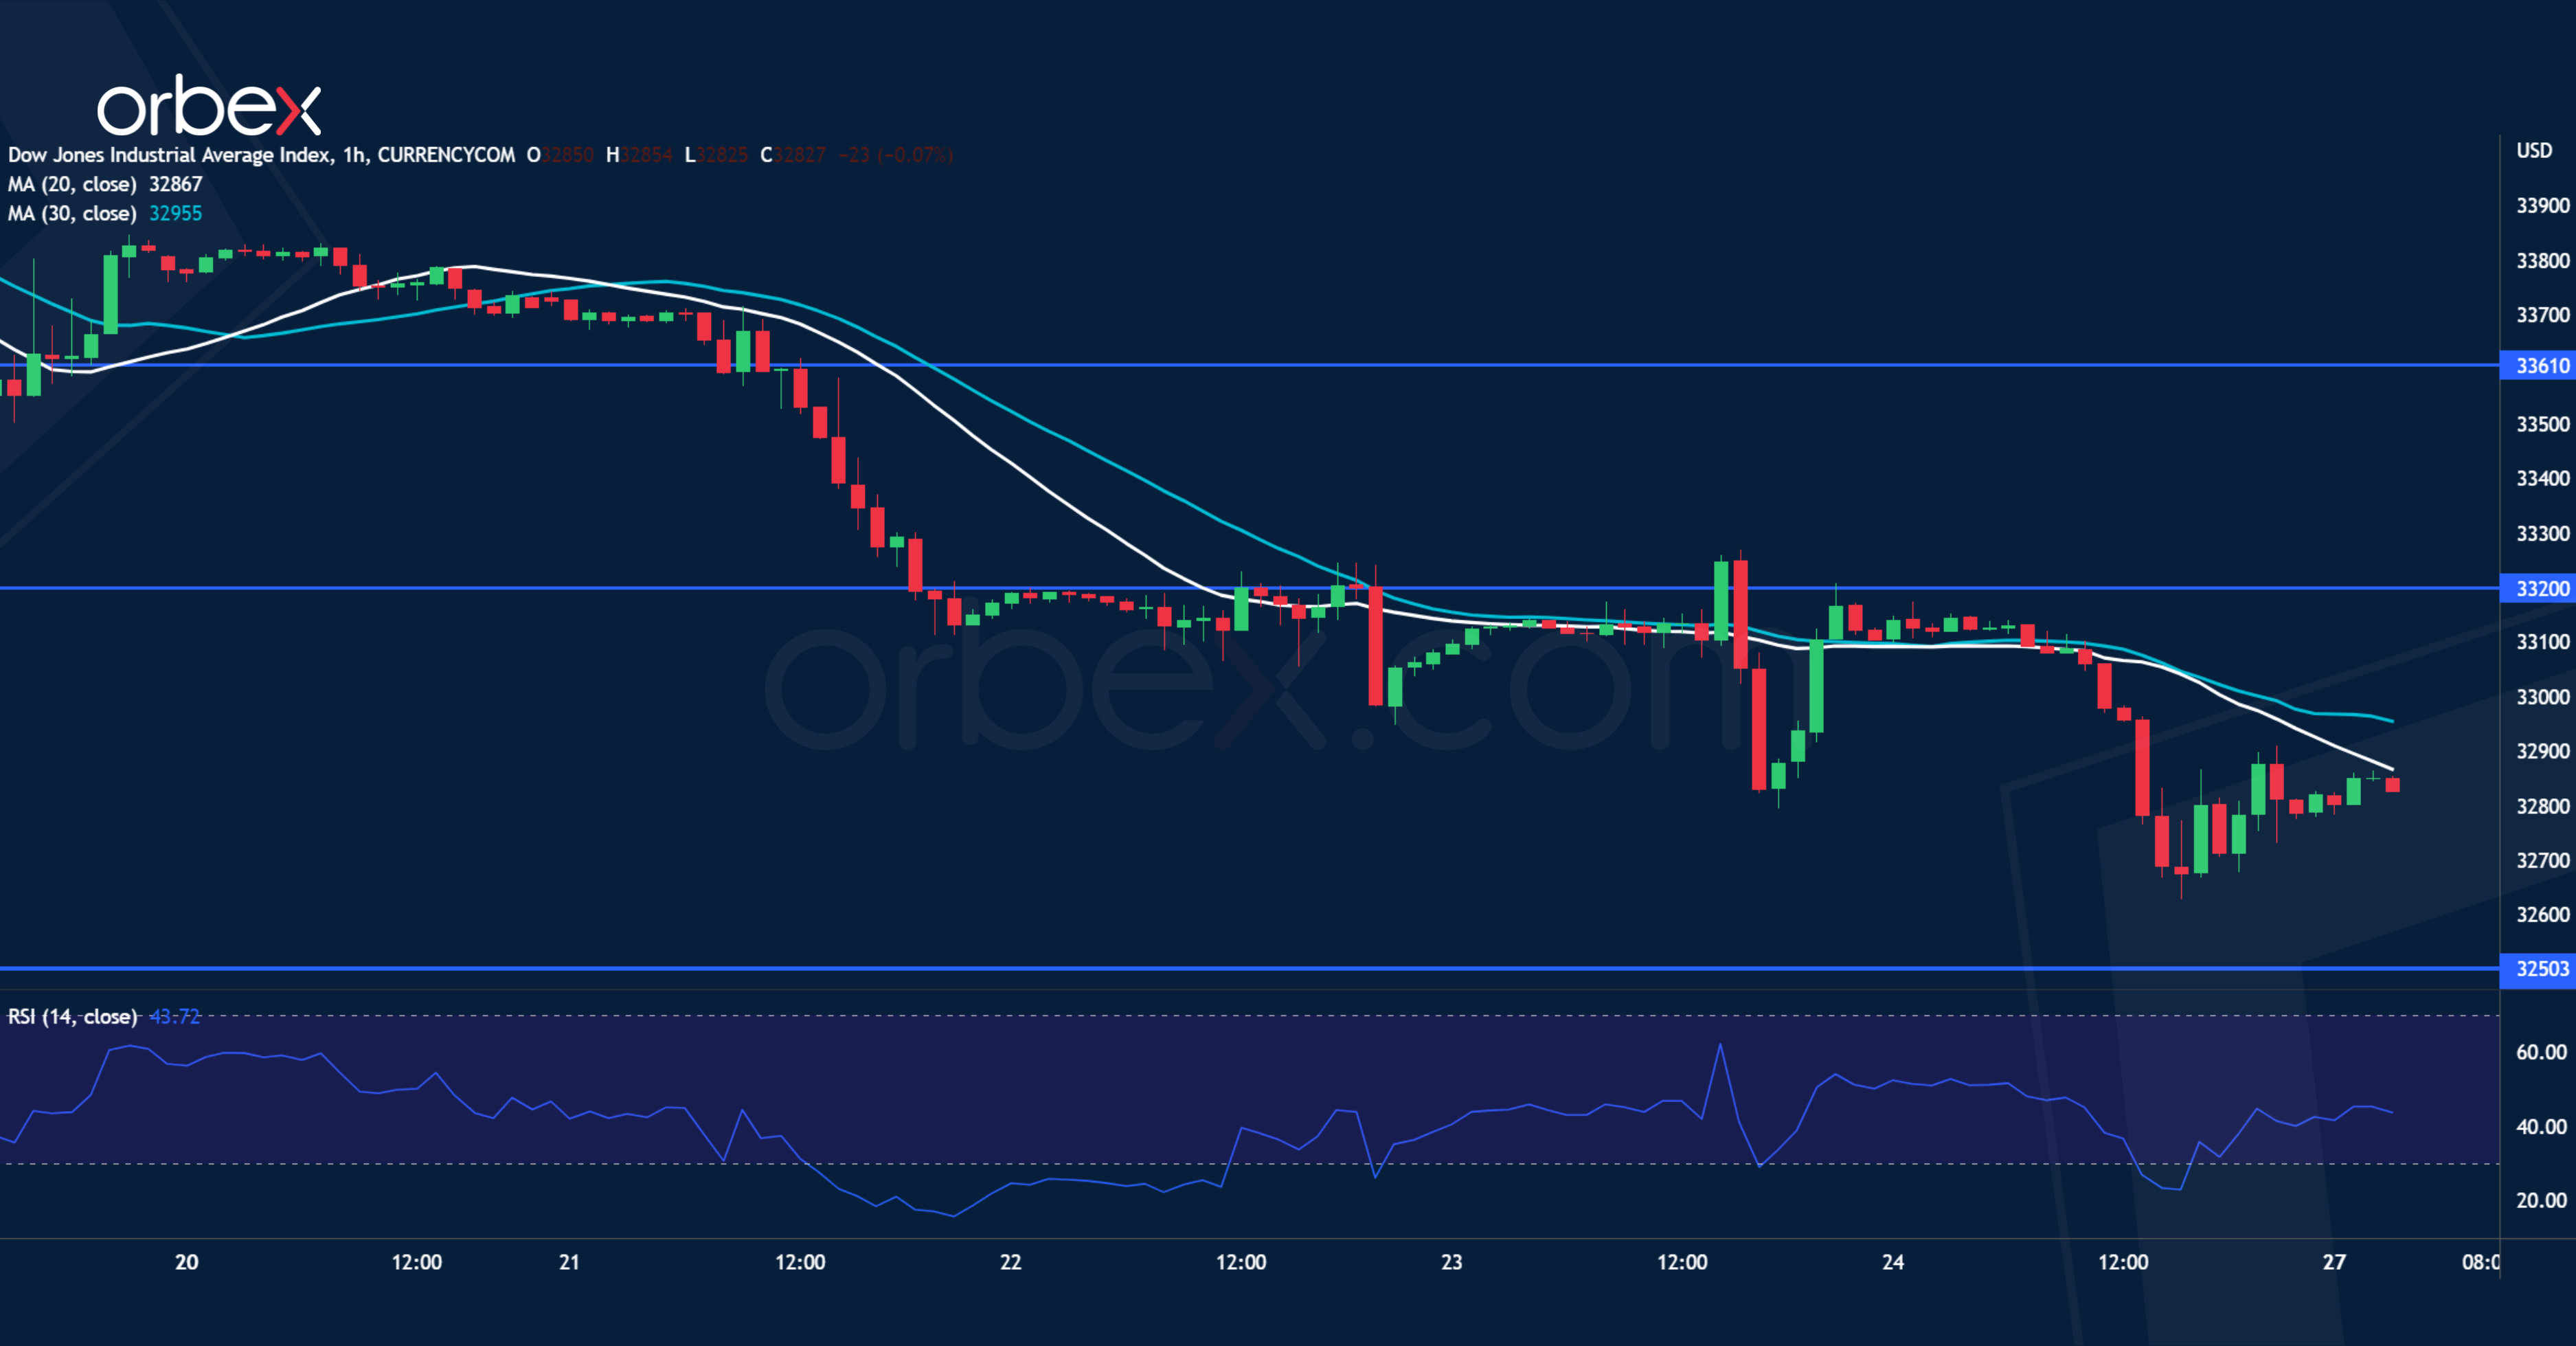
The Dow Jones 30 slips as strong economic data may allow the Fed to stick to its high rate policy. On the daily chart, the index is struggling to hold on to its gains from the past three months. A break below 33000 would cause a retest of the lower band of the current consolidation and December’s low of 32500. A break below this major floor would force more investors to unwind their positions, triggering a broader sell-off. 33200 is the immediate resistance should buyers start to make their way back.

