USOIL: We Are Waiting For The Continuation Of The Bullish Trend To The Price Level Of 90.64.

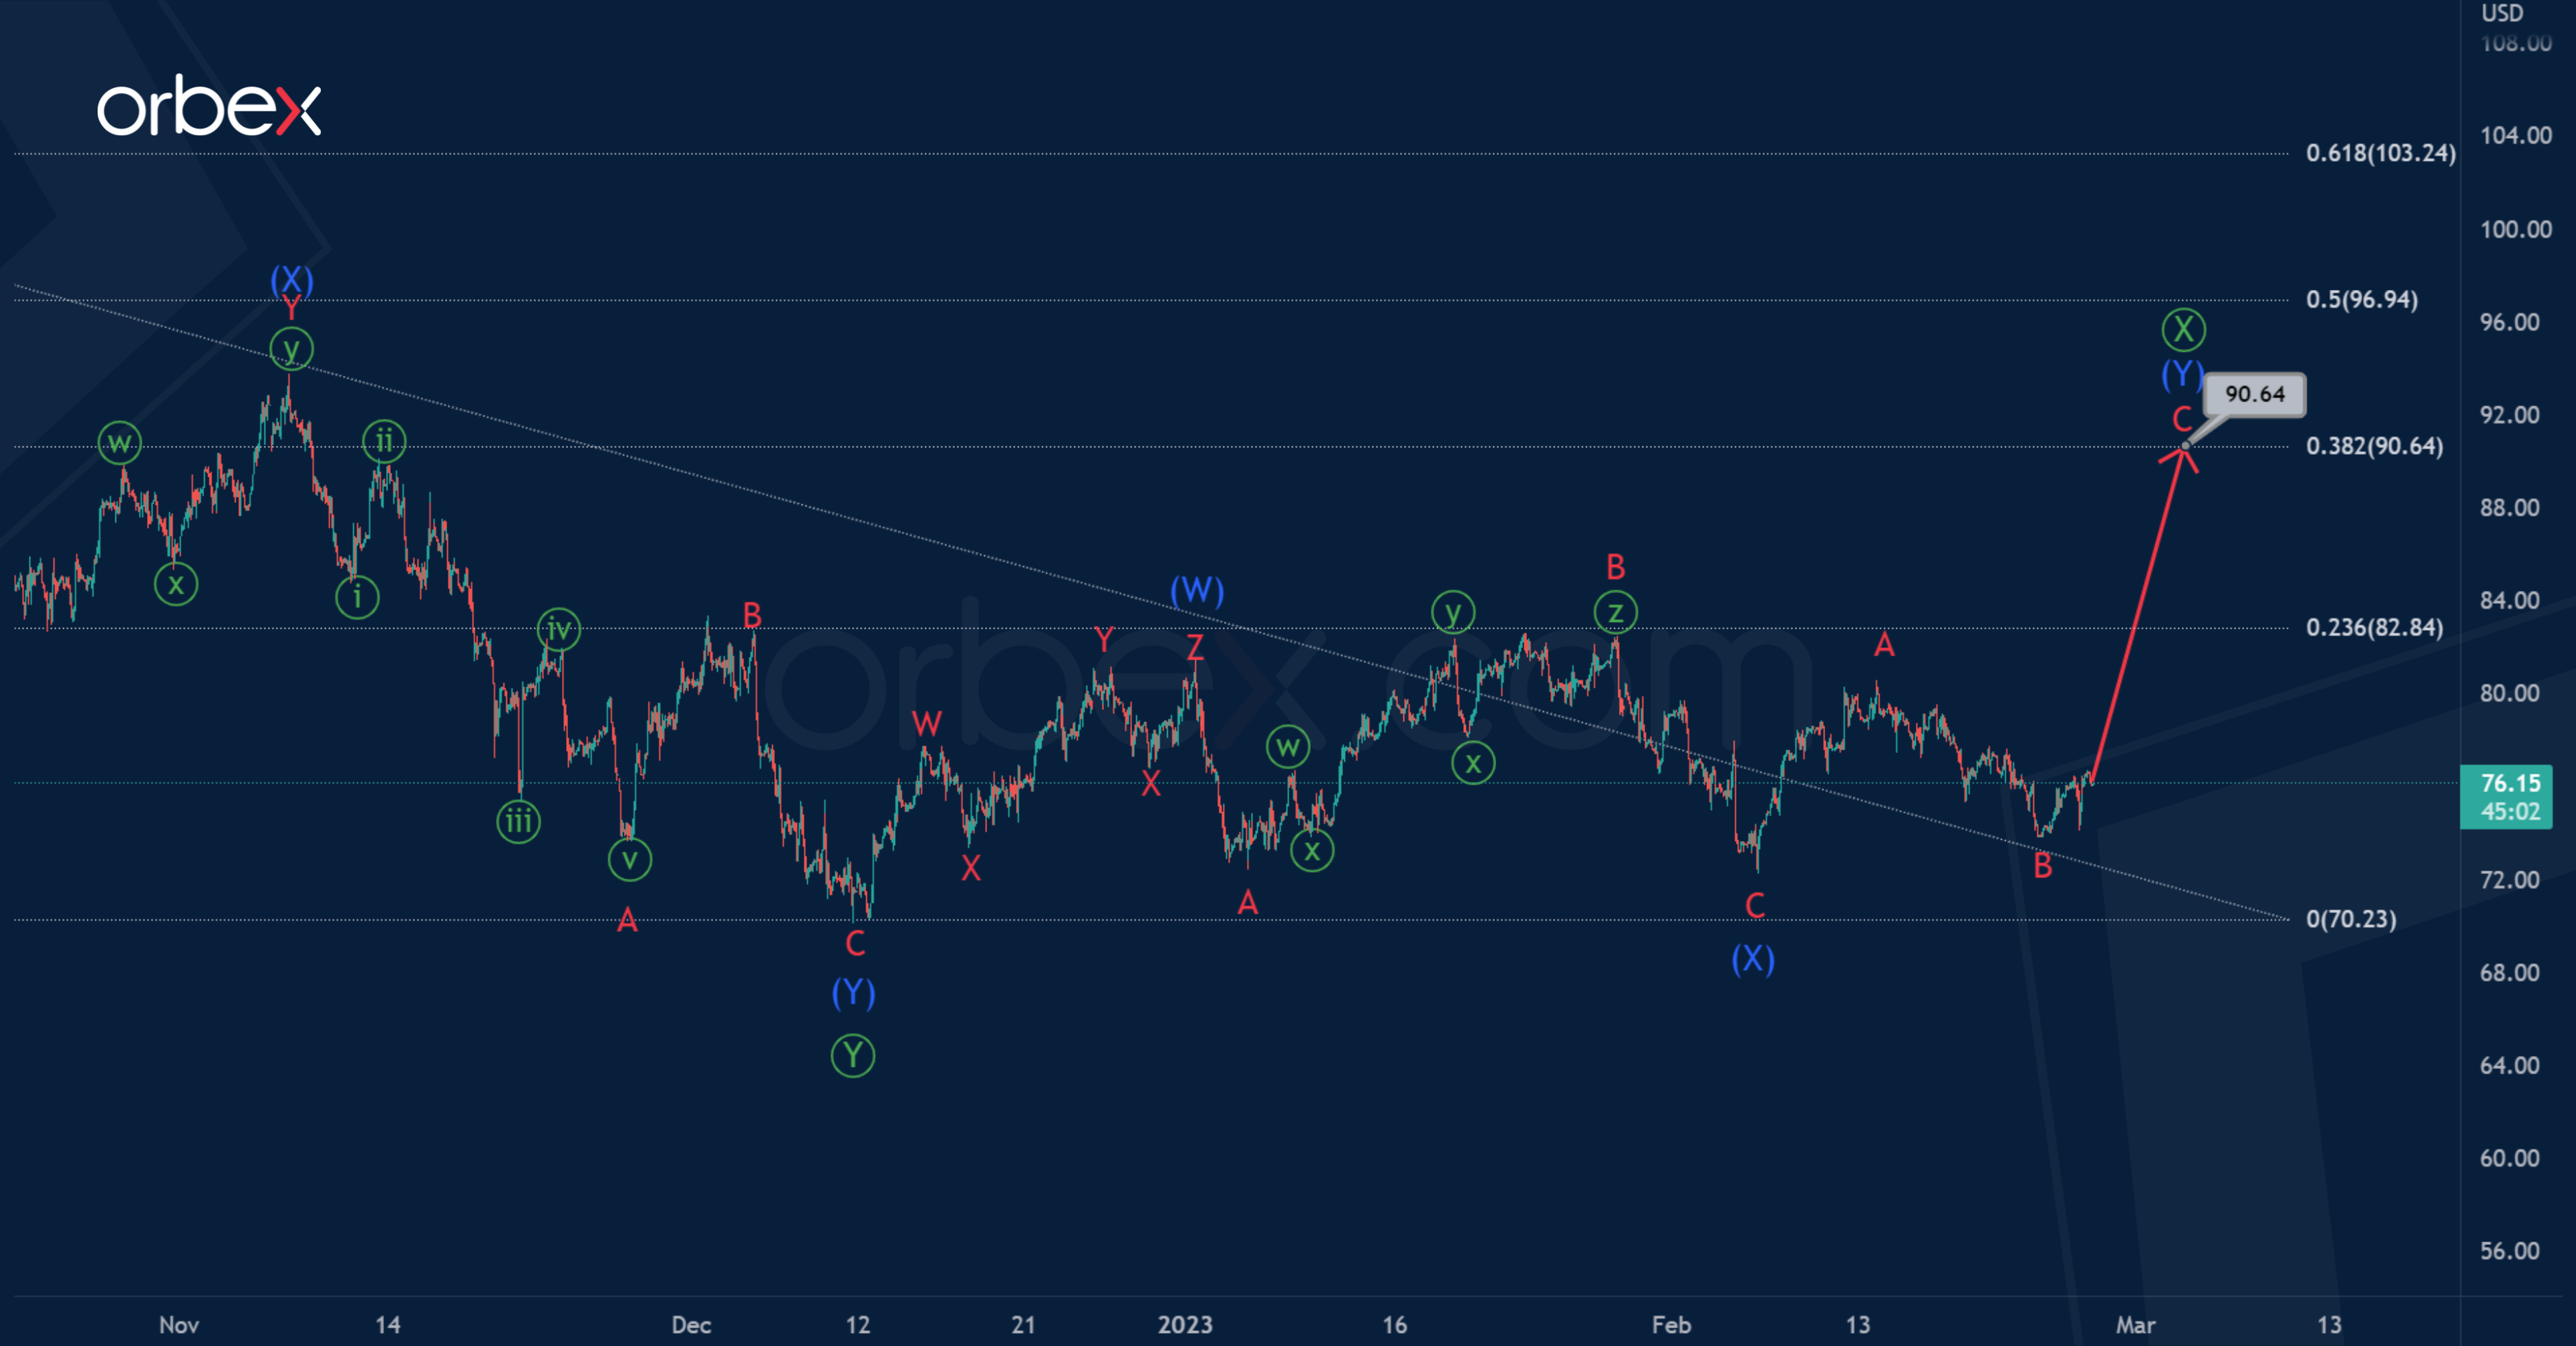
It is assumed that USOIL can form a triple zigzag pattern Ⓦ-Ⓧ-Ⓨ-Ⓧ-Ⓩ, where the primary waves Ⓦ-Ⓧ-Ⓨ seem to be fully completed.
In the last section of the chart, we see growth within the ascending primary intervening wave Ⓧ. Perhaps it takes the form of an intermediate double zigzag (W)-(X)-(Y), and now the price is going up in the last actionary wave (Y).
It is likely that the wave (Y) will end near 90.64, taking the form of a zigzag A-B-C. At the specified level, wave Ⓧ will be at 38.2% of wave Ⓨ.

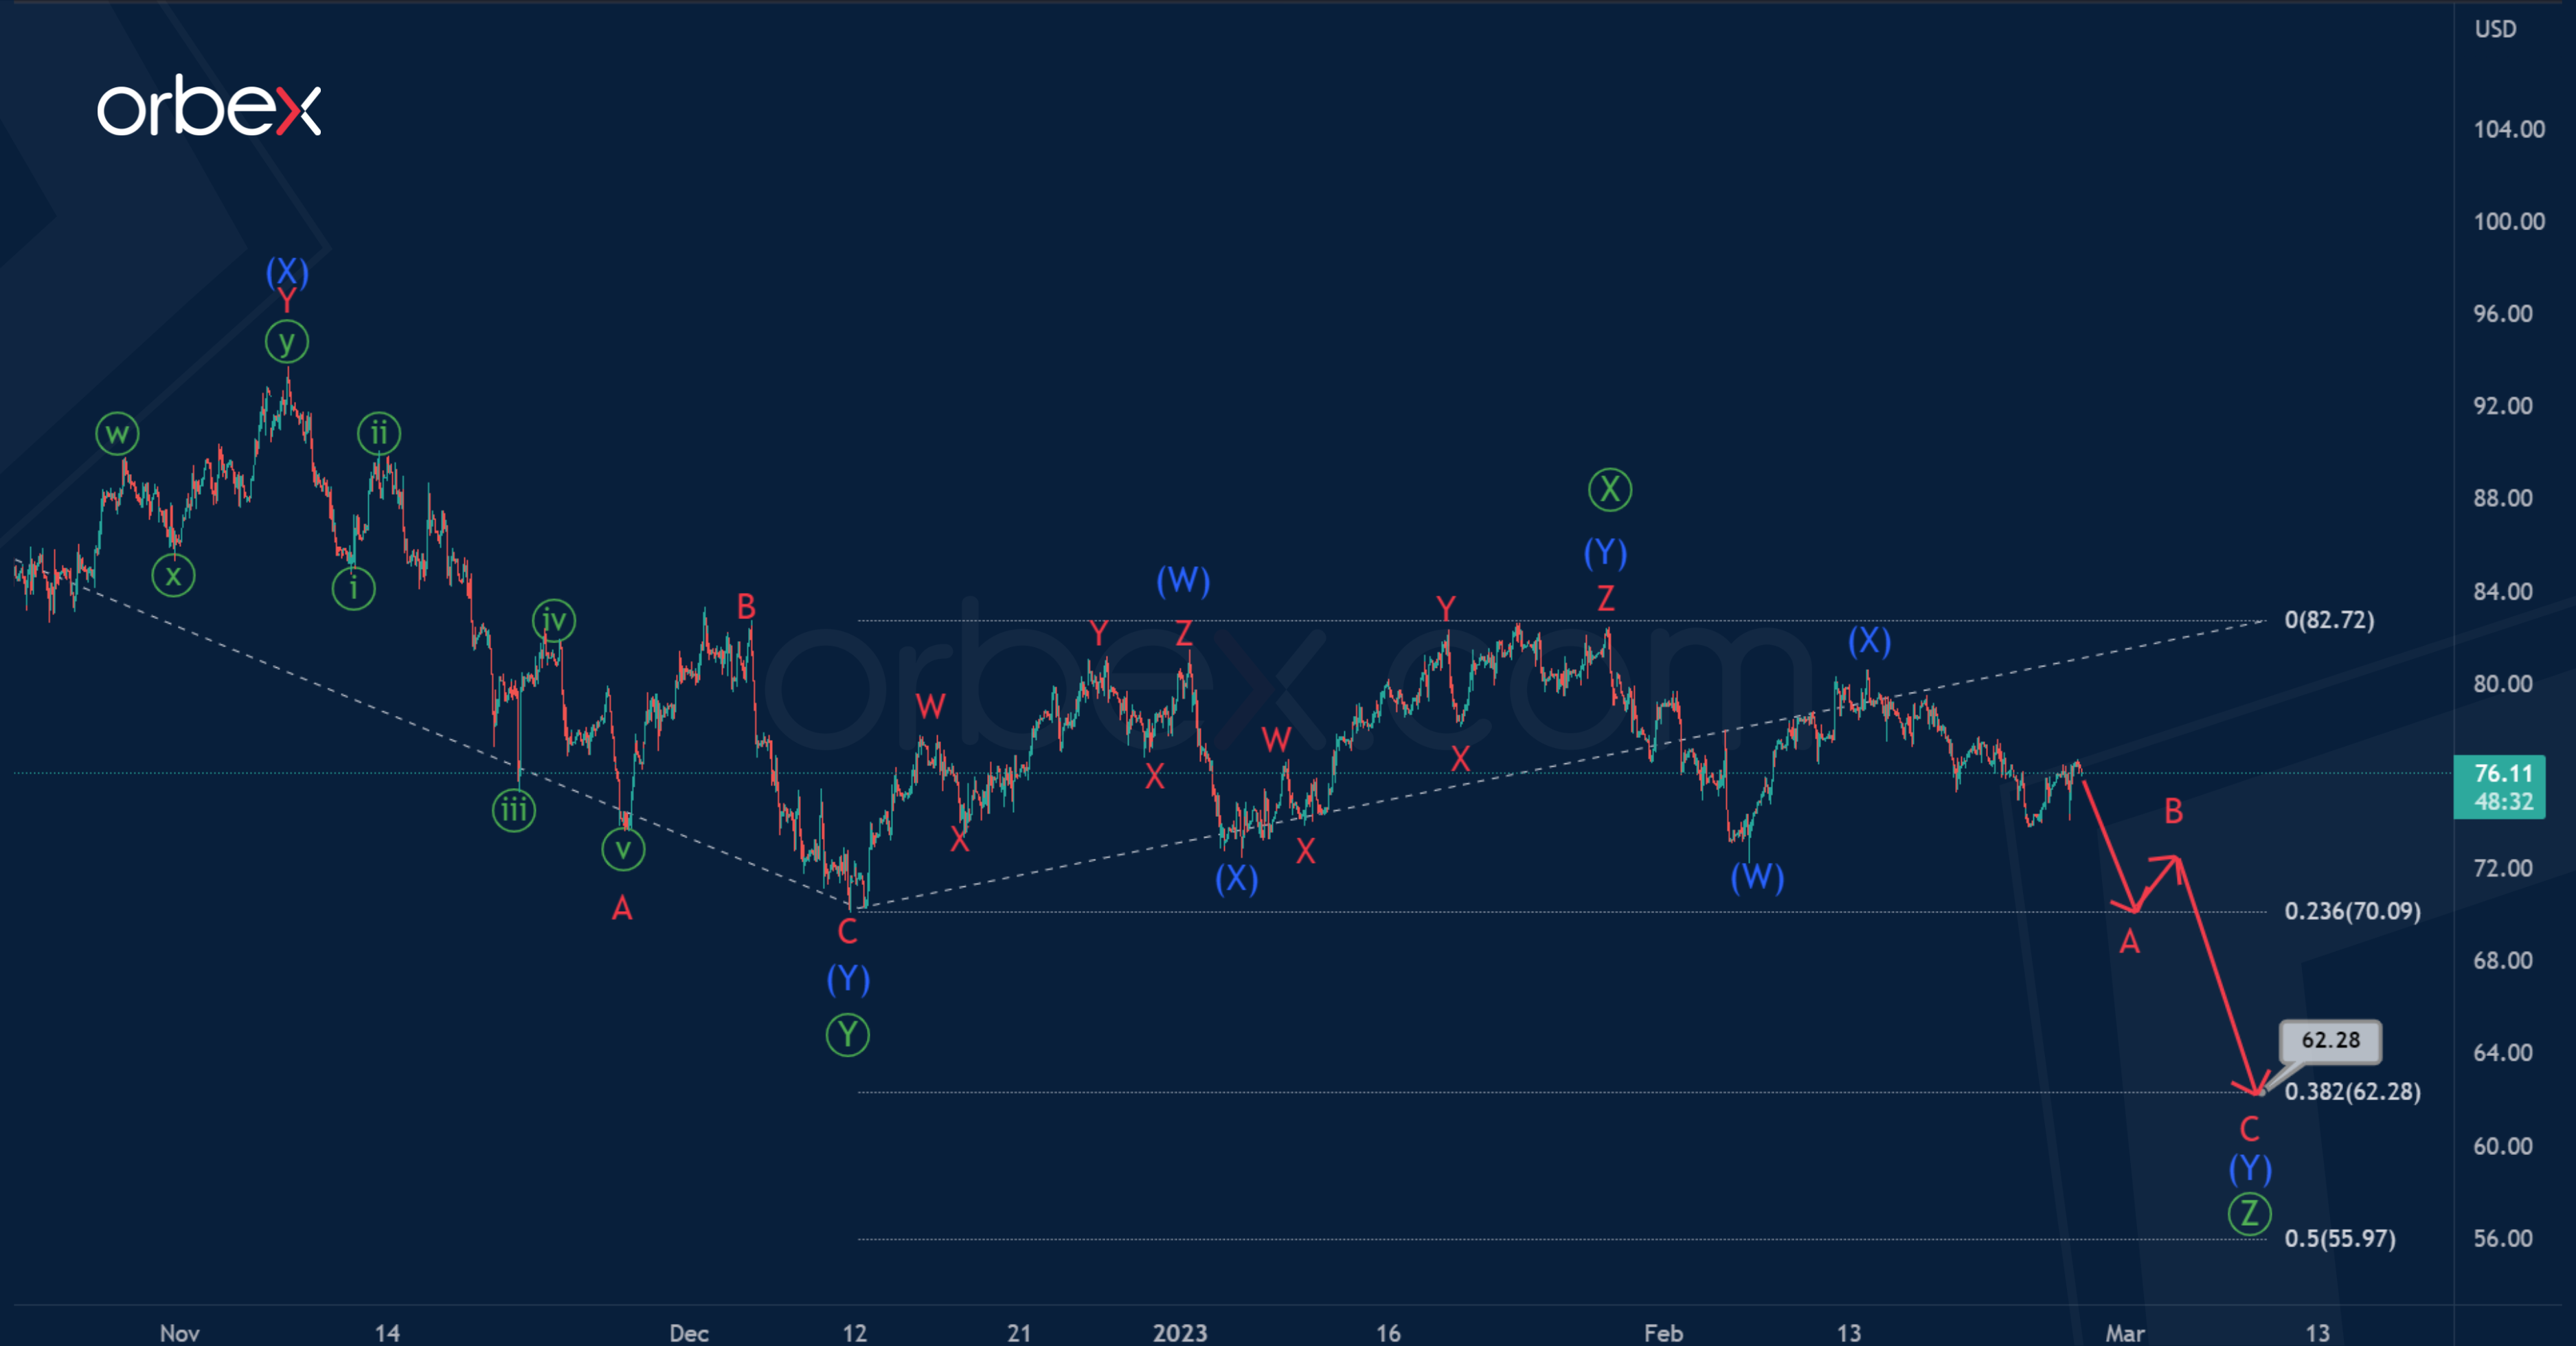
In the second variant, the intervening wave Ⓧ is already finished, at 82.72.
In the near future, we will observe the fall and development of the primary actionary wave Ⓩ in the form of an intermediate double zigzag (W)-(X)-(Y), which at the moment can be built in half.
It is assumed that the bearish trend will continue to 62.28. At that level, primary wave Ⓩ will be at 38.2% of wave Ⓨ.

