
GBPUSD stages recovery
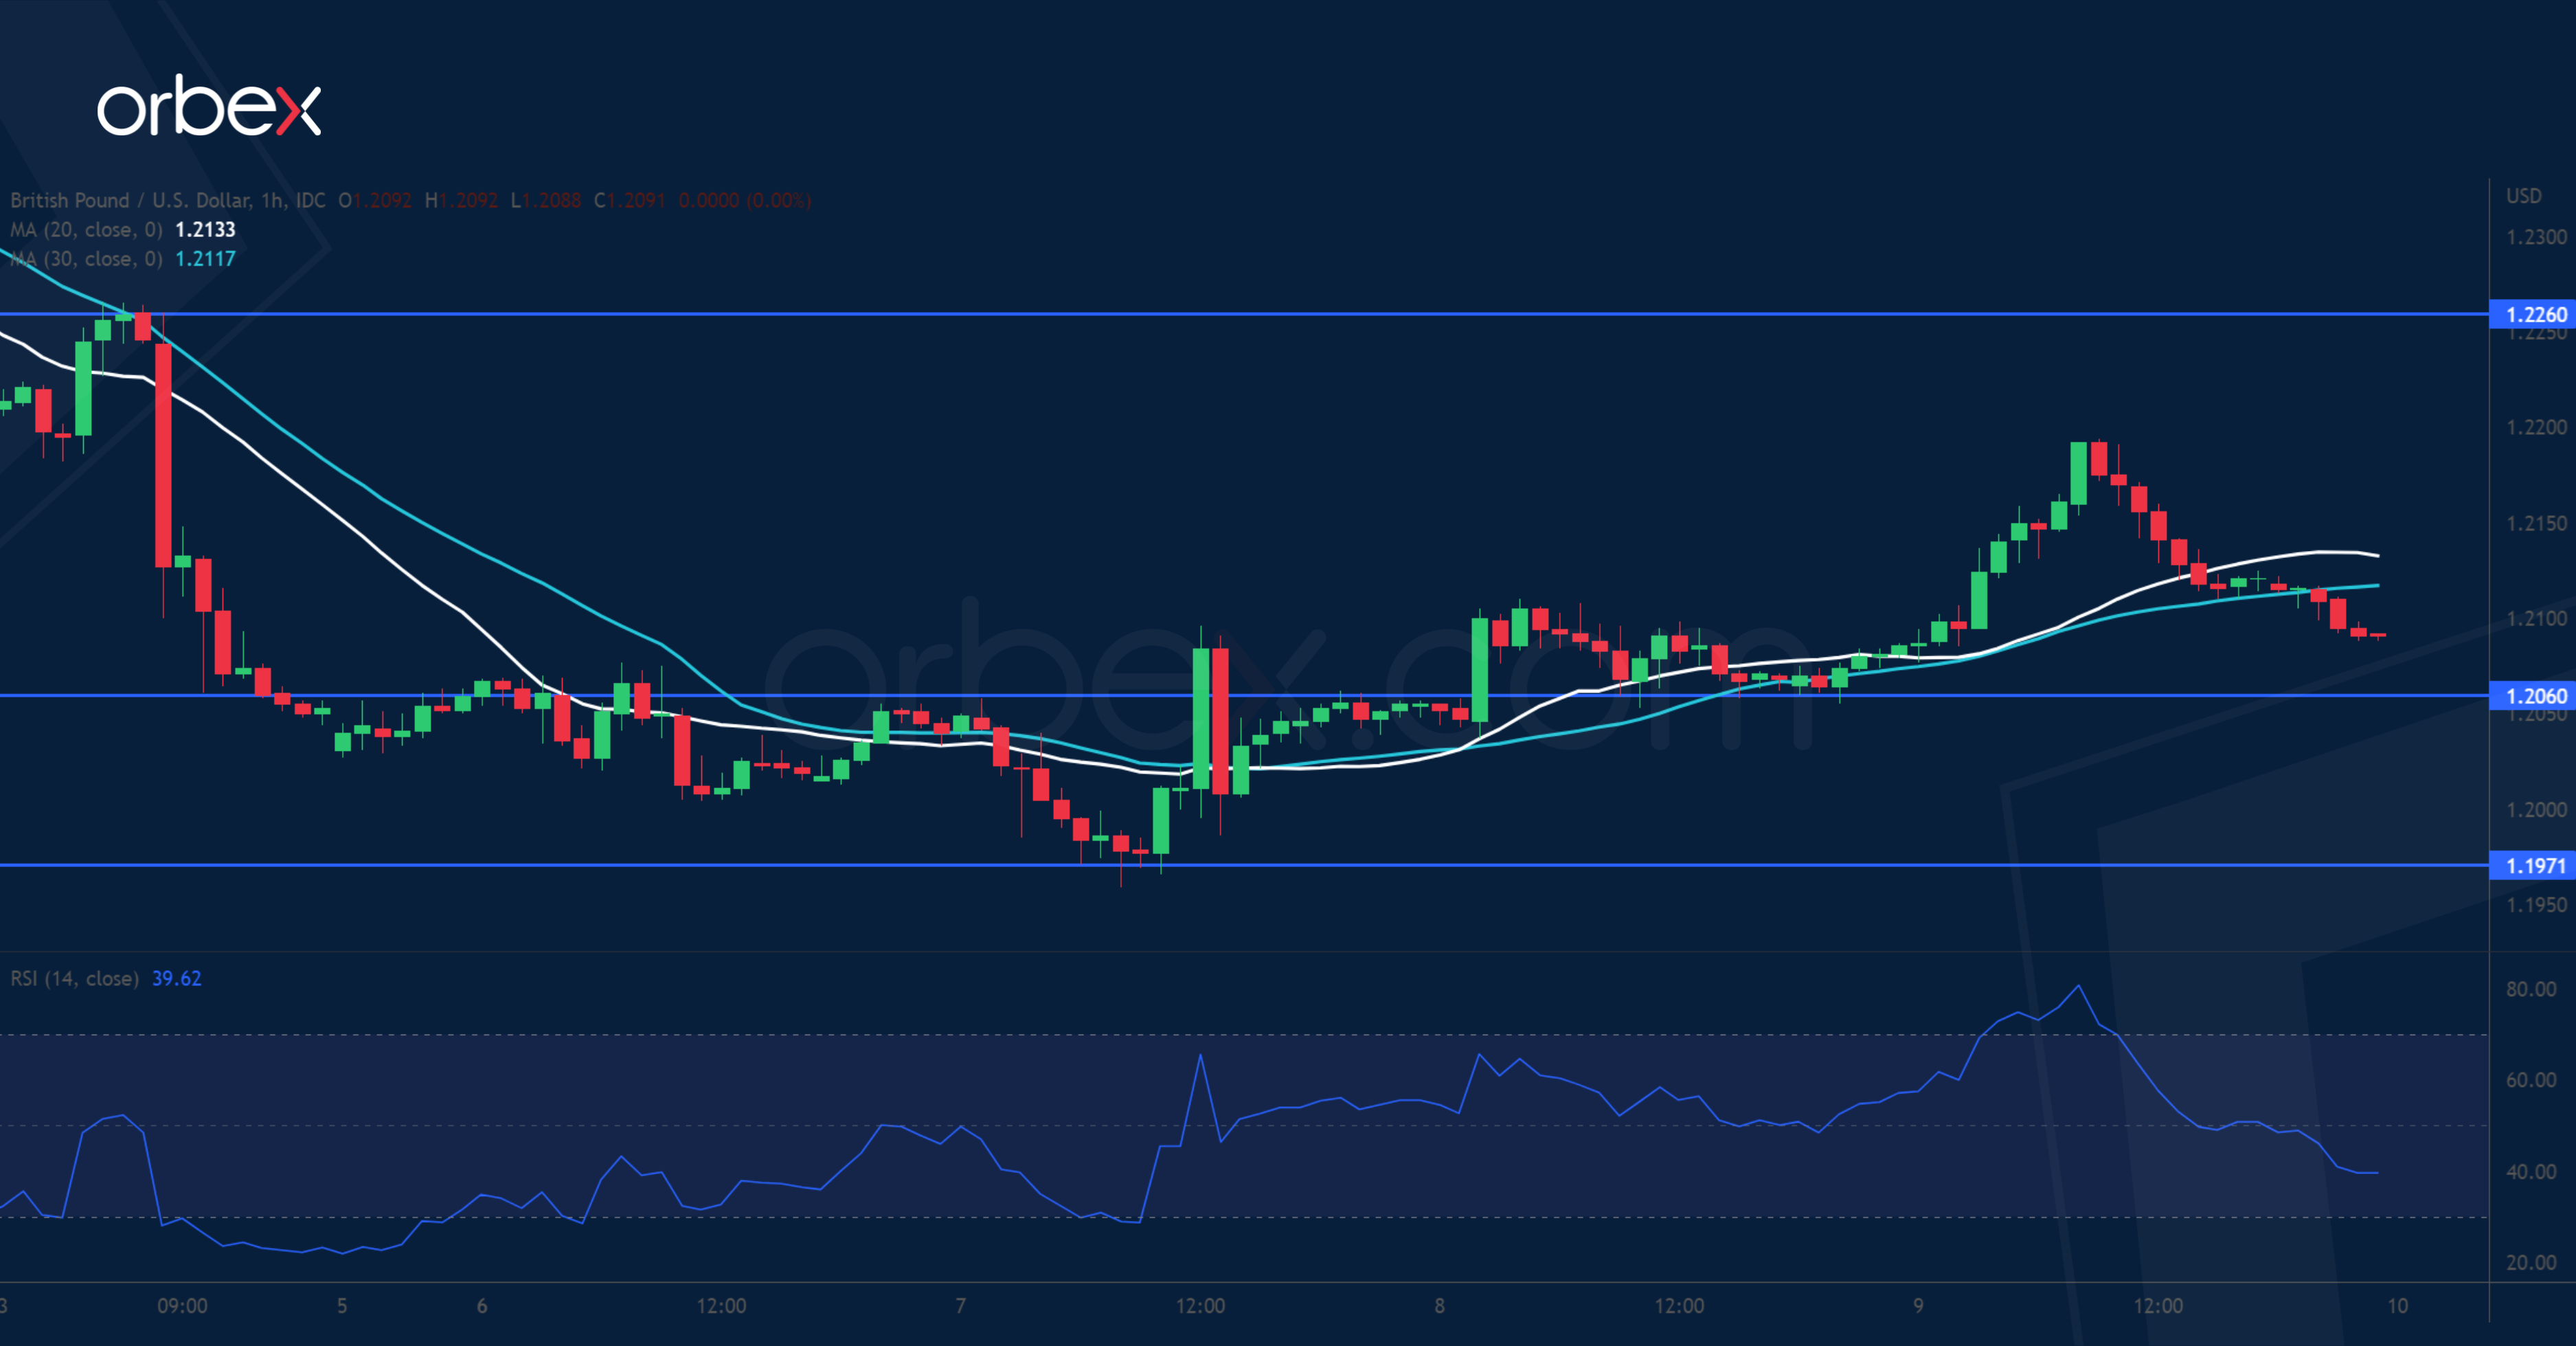
The pound retreats as traders reposition ahead of a series of UK data. After coming off December’s high of 1.2440, the pair is staging a bounce from the demand zone around the psychological level of 1.2000. The recovery theme remains intact from a medium-term perspective. Though the short-term price action could be choppy as the cable strives to gain a secure footing above 1.2060. 1.2260 at the tip of a previously faded rebound is a key hurdle, and its breach would bring the pair back to its recent peak near 1.2400.
NZDUSD struggles to bounce

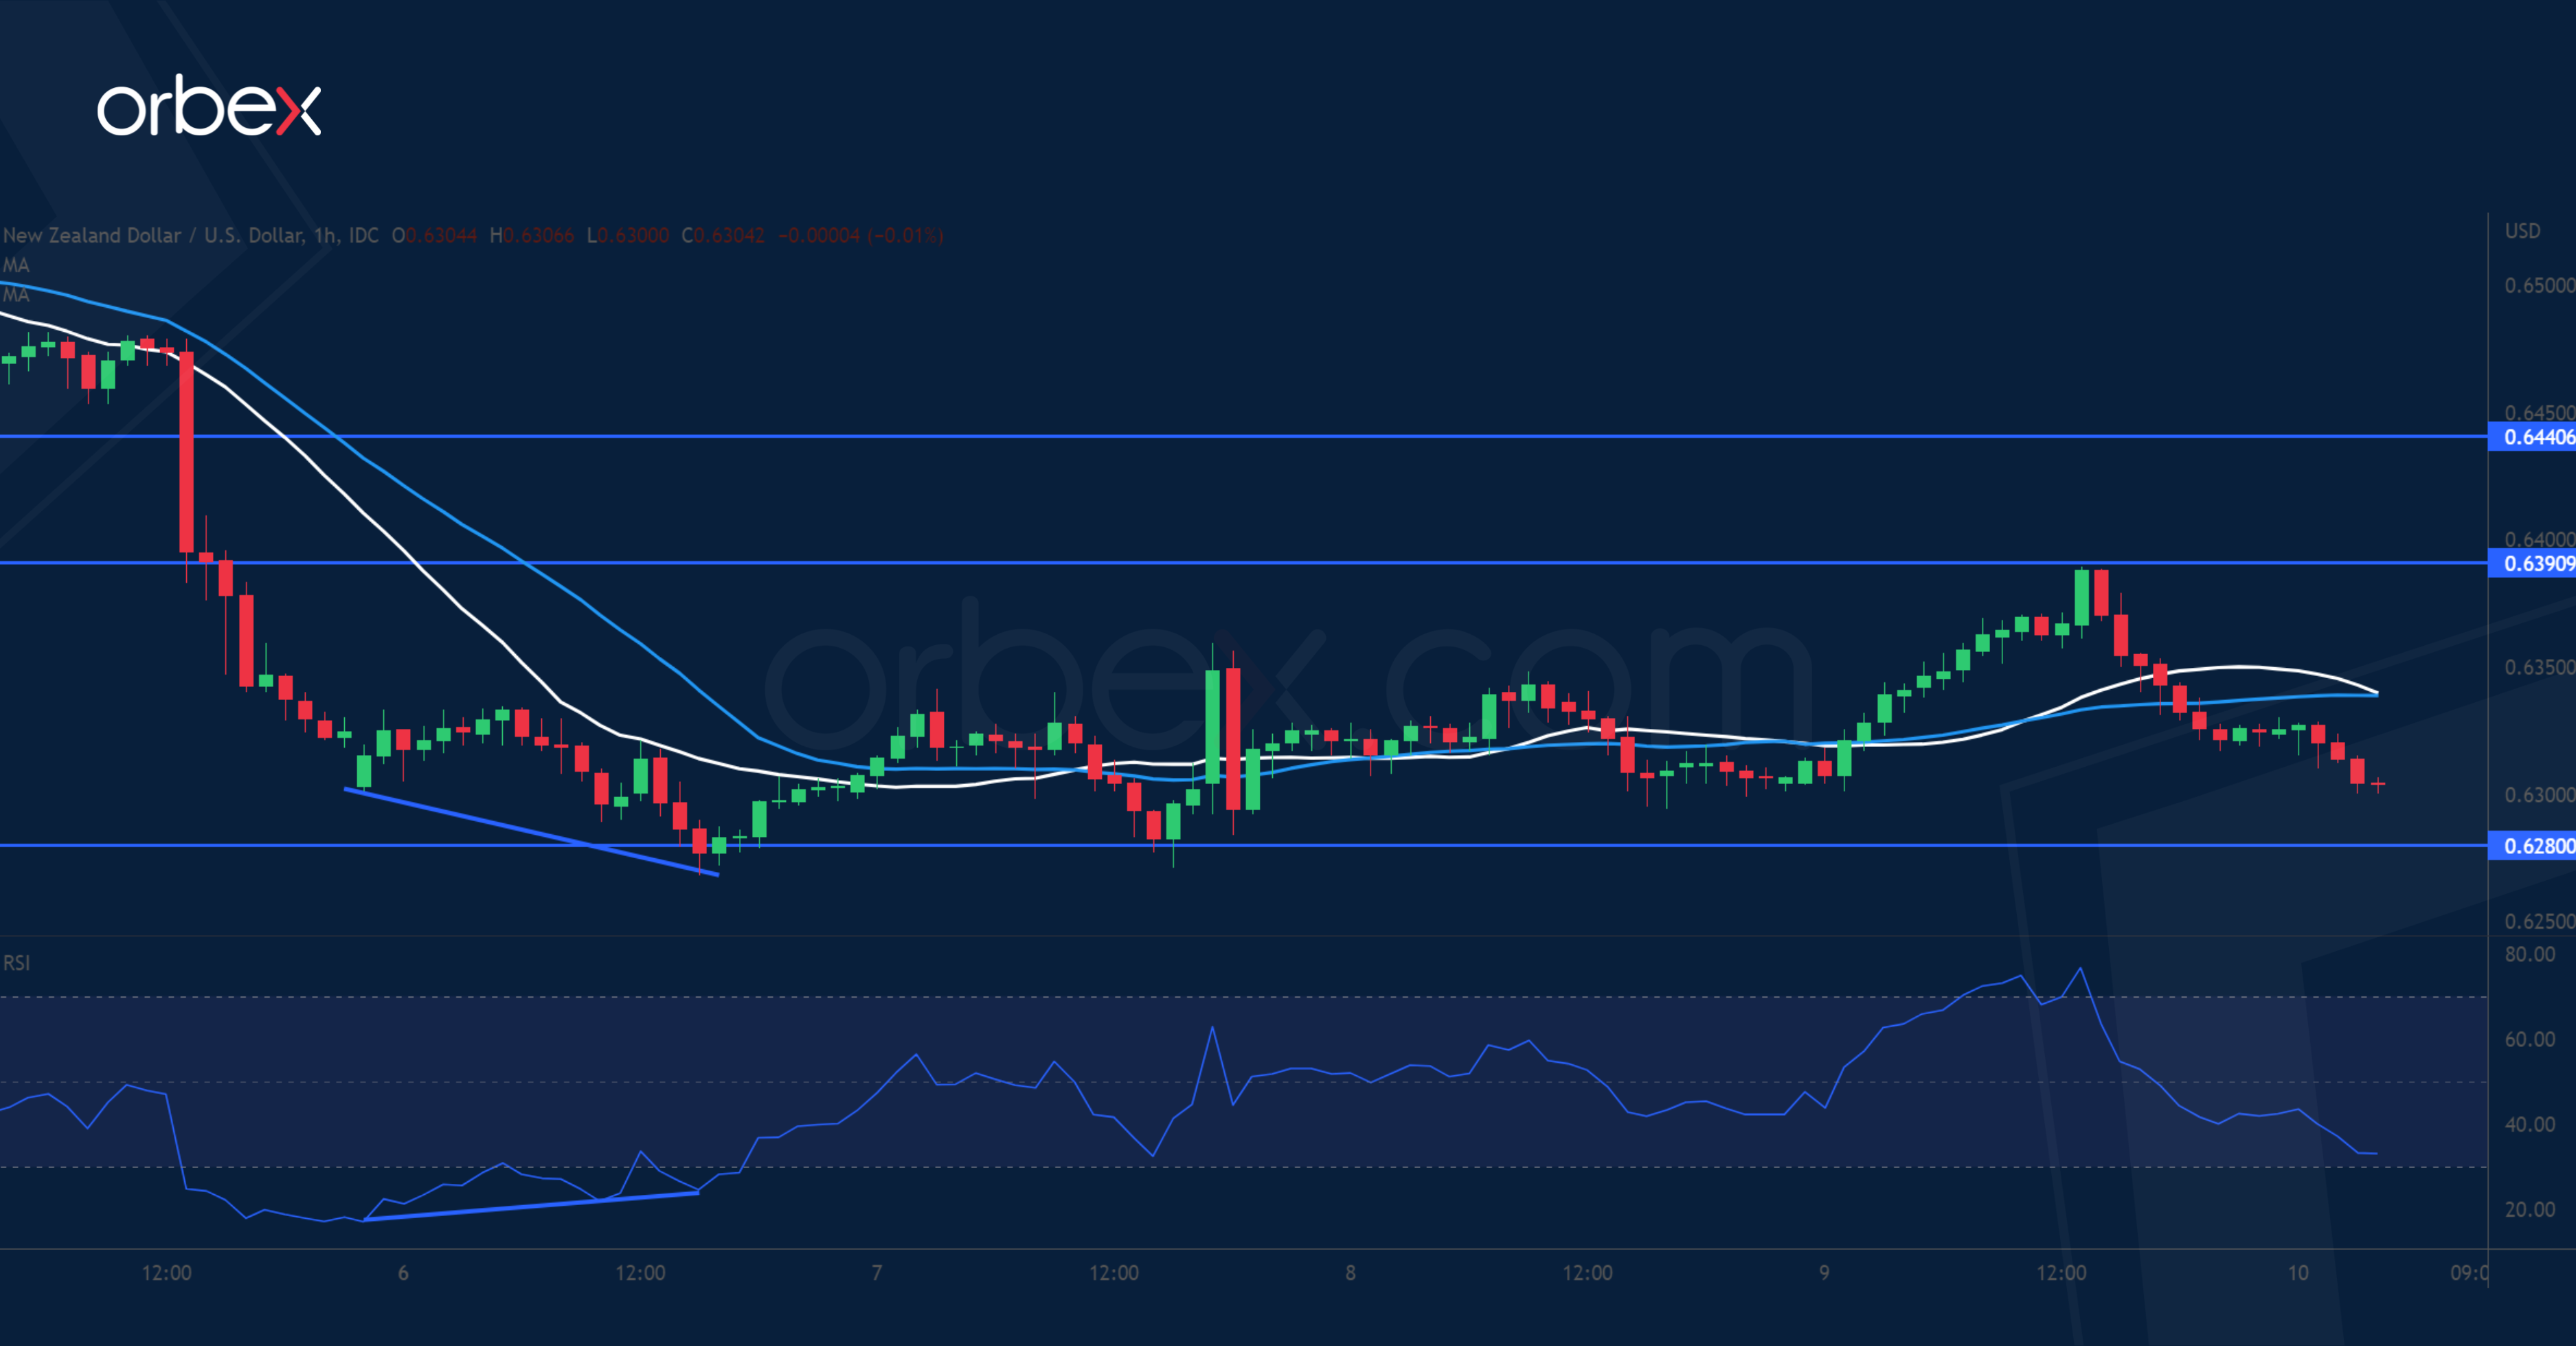
The New Zealand dollar falls back over subdued risk appetite. The pair is looking to hold on to its gains after breaking above the December high of 0.6500. Last month’s swing low around 0.6200-0.6280 is a major demand zone to keep the bullish bias valid. A bullish RSI divergence on the hourly chart is an encouraging sign after the downward momentum faded, but strong offers emerged near the support-turned-resistance at 0.6390 as trapped buyers sought to get out. 0.6280 is the first layer of defence on the downside.
SPX 500 breaks under trend line
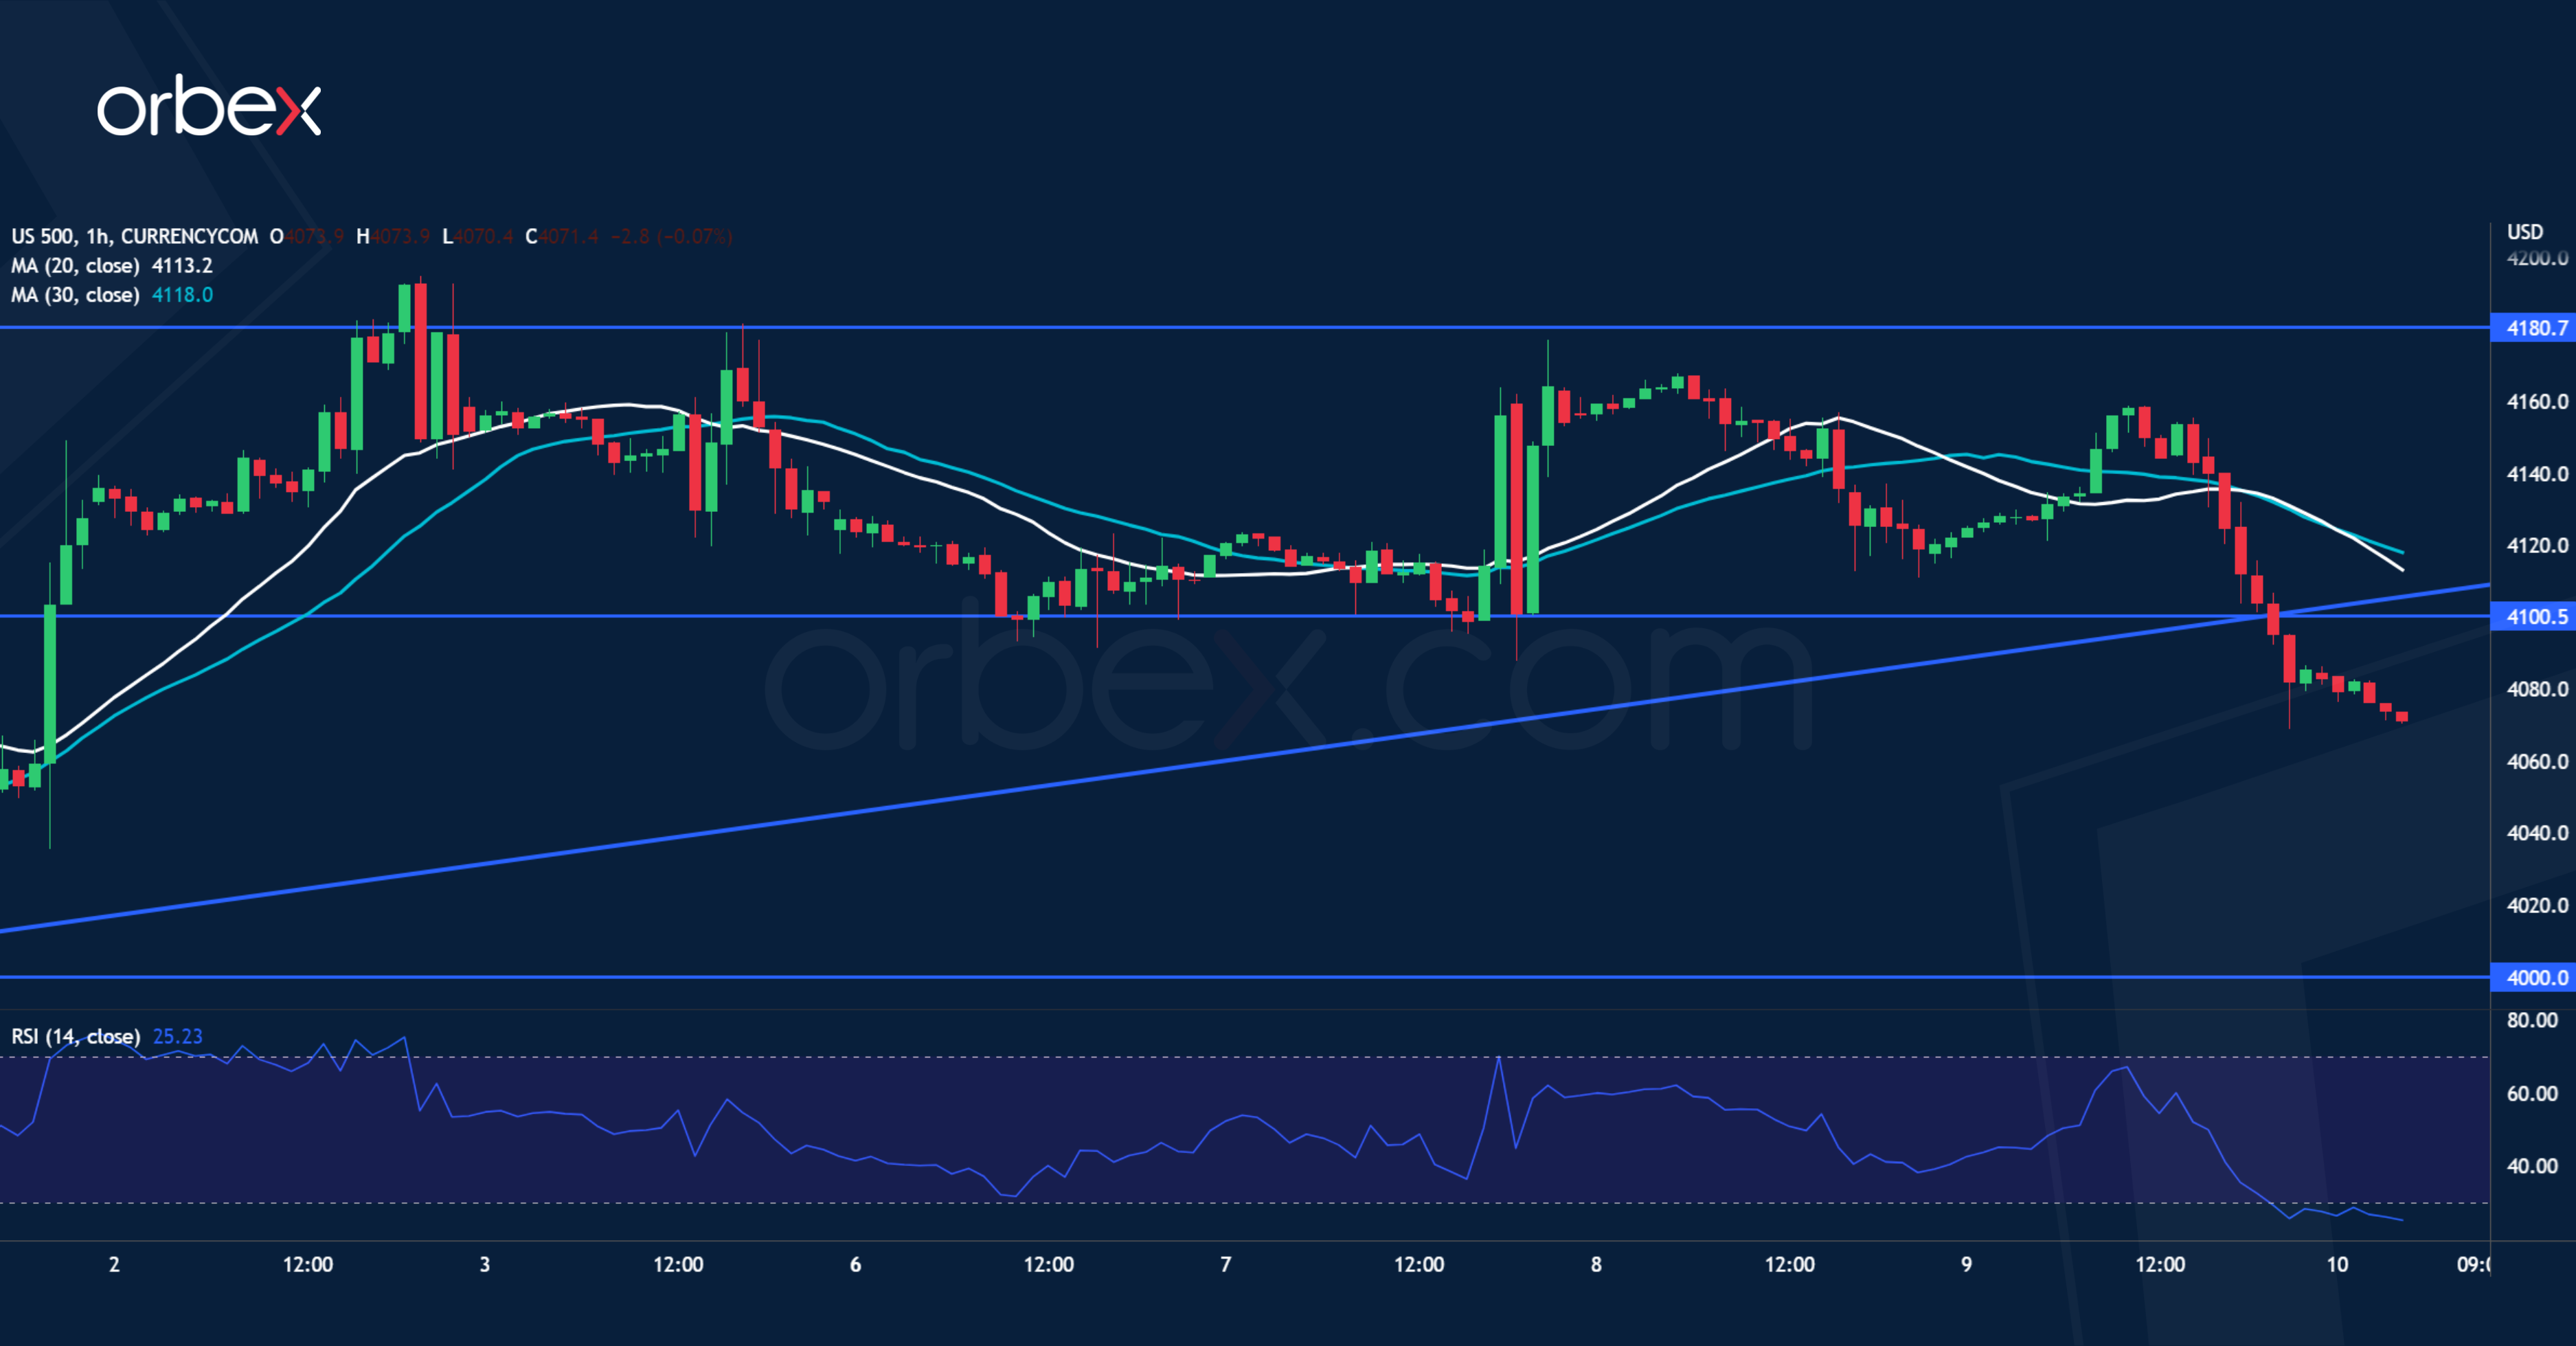
The S&P 500 pared earlier gains after US Treasury yields climbed. On the daily chart, the rally has gained traction after a break above the double top (4130) formed by the September and December highs. But the mood has turned south in the short-term after a fall under the rising trend line from January’s breakout rally. This dynamic support was confluent with the previous swing low of 4100 and the breach has invalidated this demand area, making it a fresh resistance. The psychological level of 4000 is a key support.

![Credit Card 160×600 [EN]](https://assets.iorbex.com/blog/wp-content/uploads/2023/06/13144507/Blog-Banner_EN-Banner_160X600X2.webp)