
USDCAD gives up gains
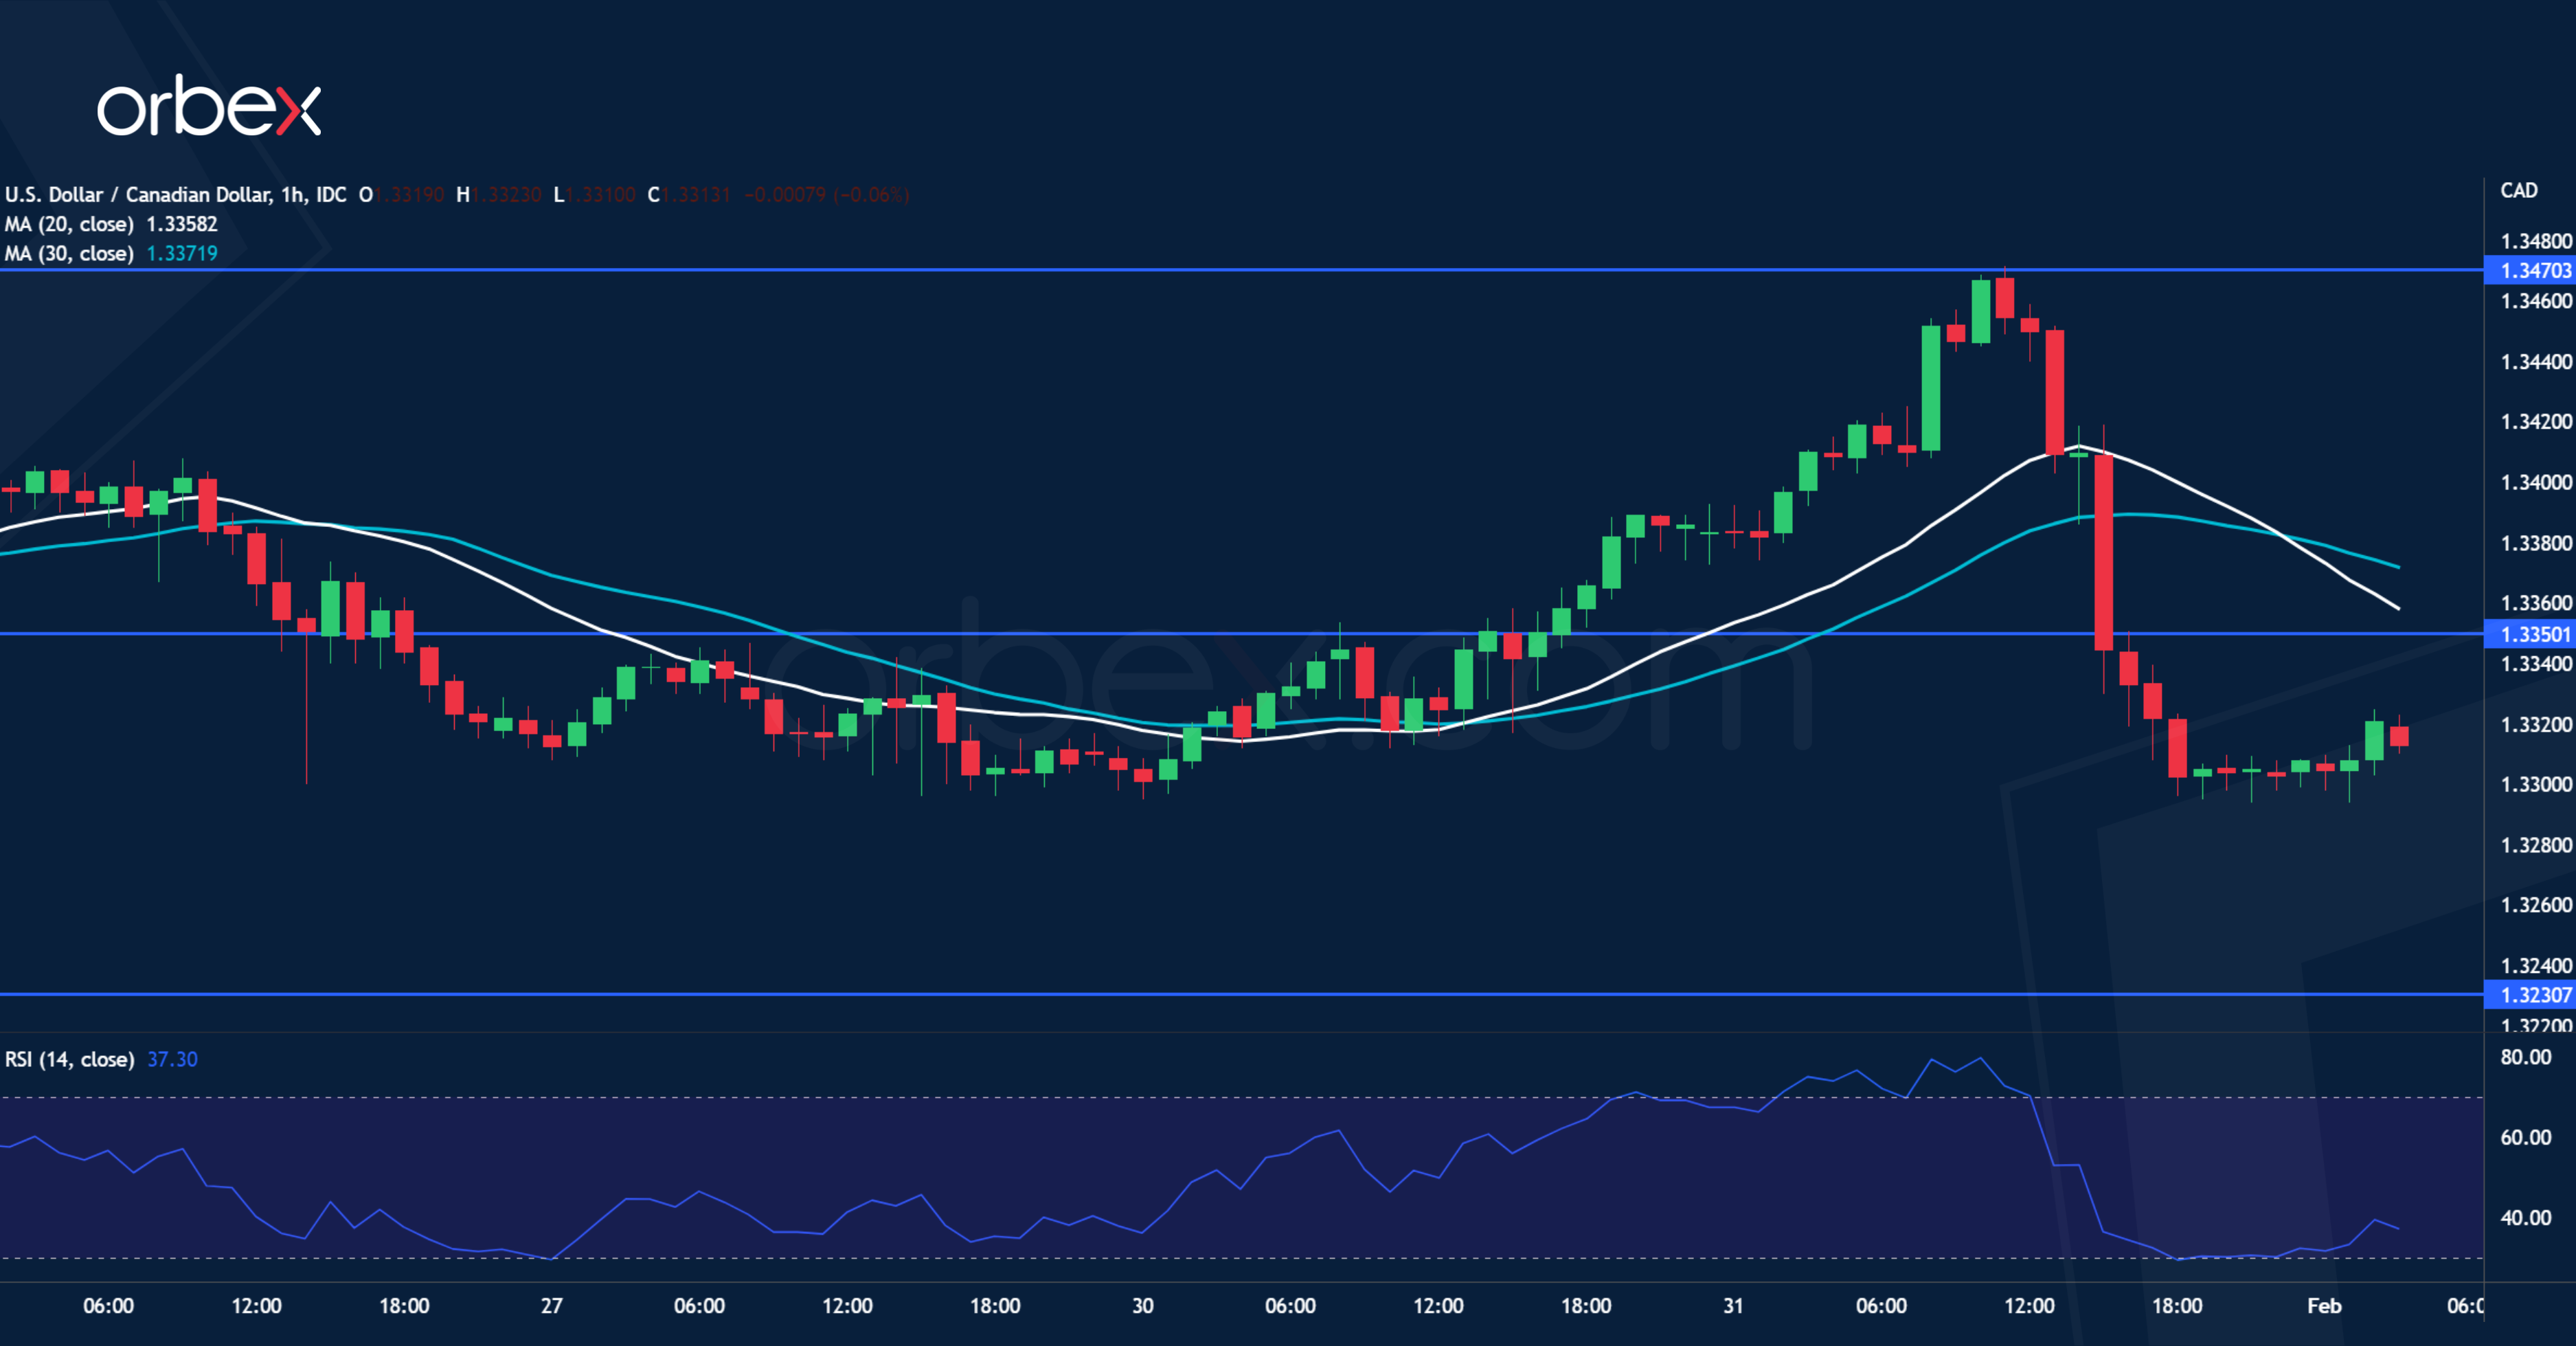
The Canadian dollar recouped losses after November’s GDP beat expectations. On the daily chart, the pair is still in a flag consolidation.

A break above the previous resistance of 1.3400 eased some pressure but was not enough to clear the supply zone between 1.3470 and 1.3500. A sharp reversal below 1.3380 then 1.3300 reveals that the bears are still in control of the price action. November’s swing low at 1.3230 is a critical support as the RSI drops into oversold territory. 1.3350 is the immediate resistance.
NZDUSD in corrective mode
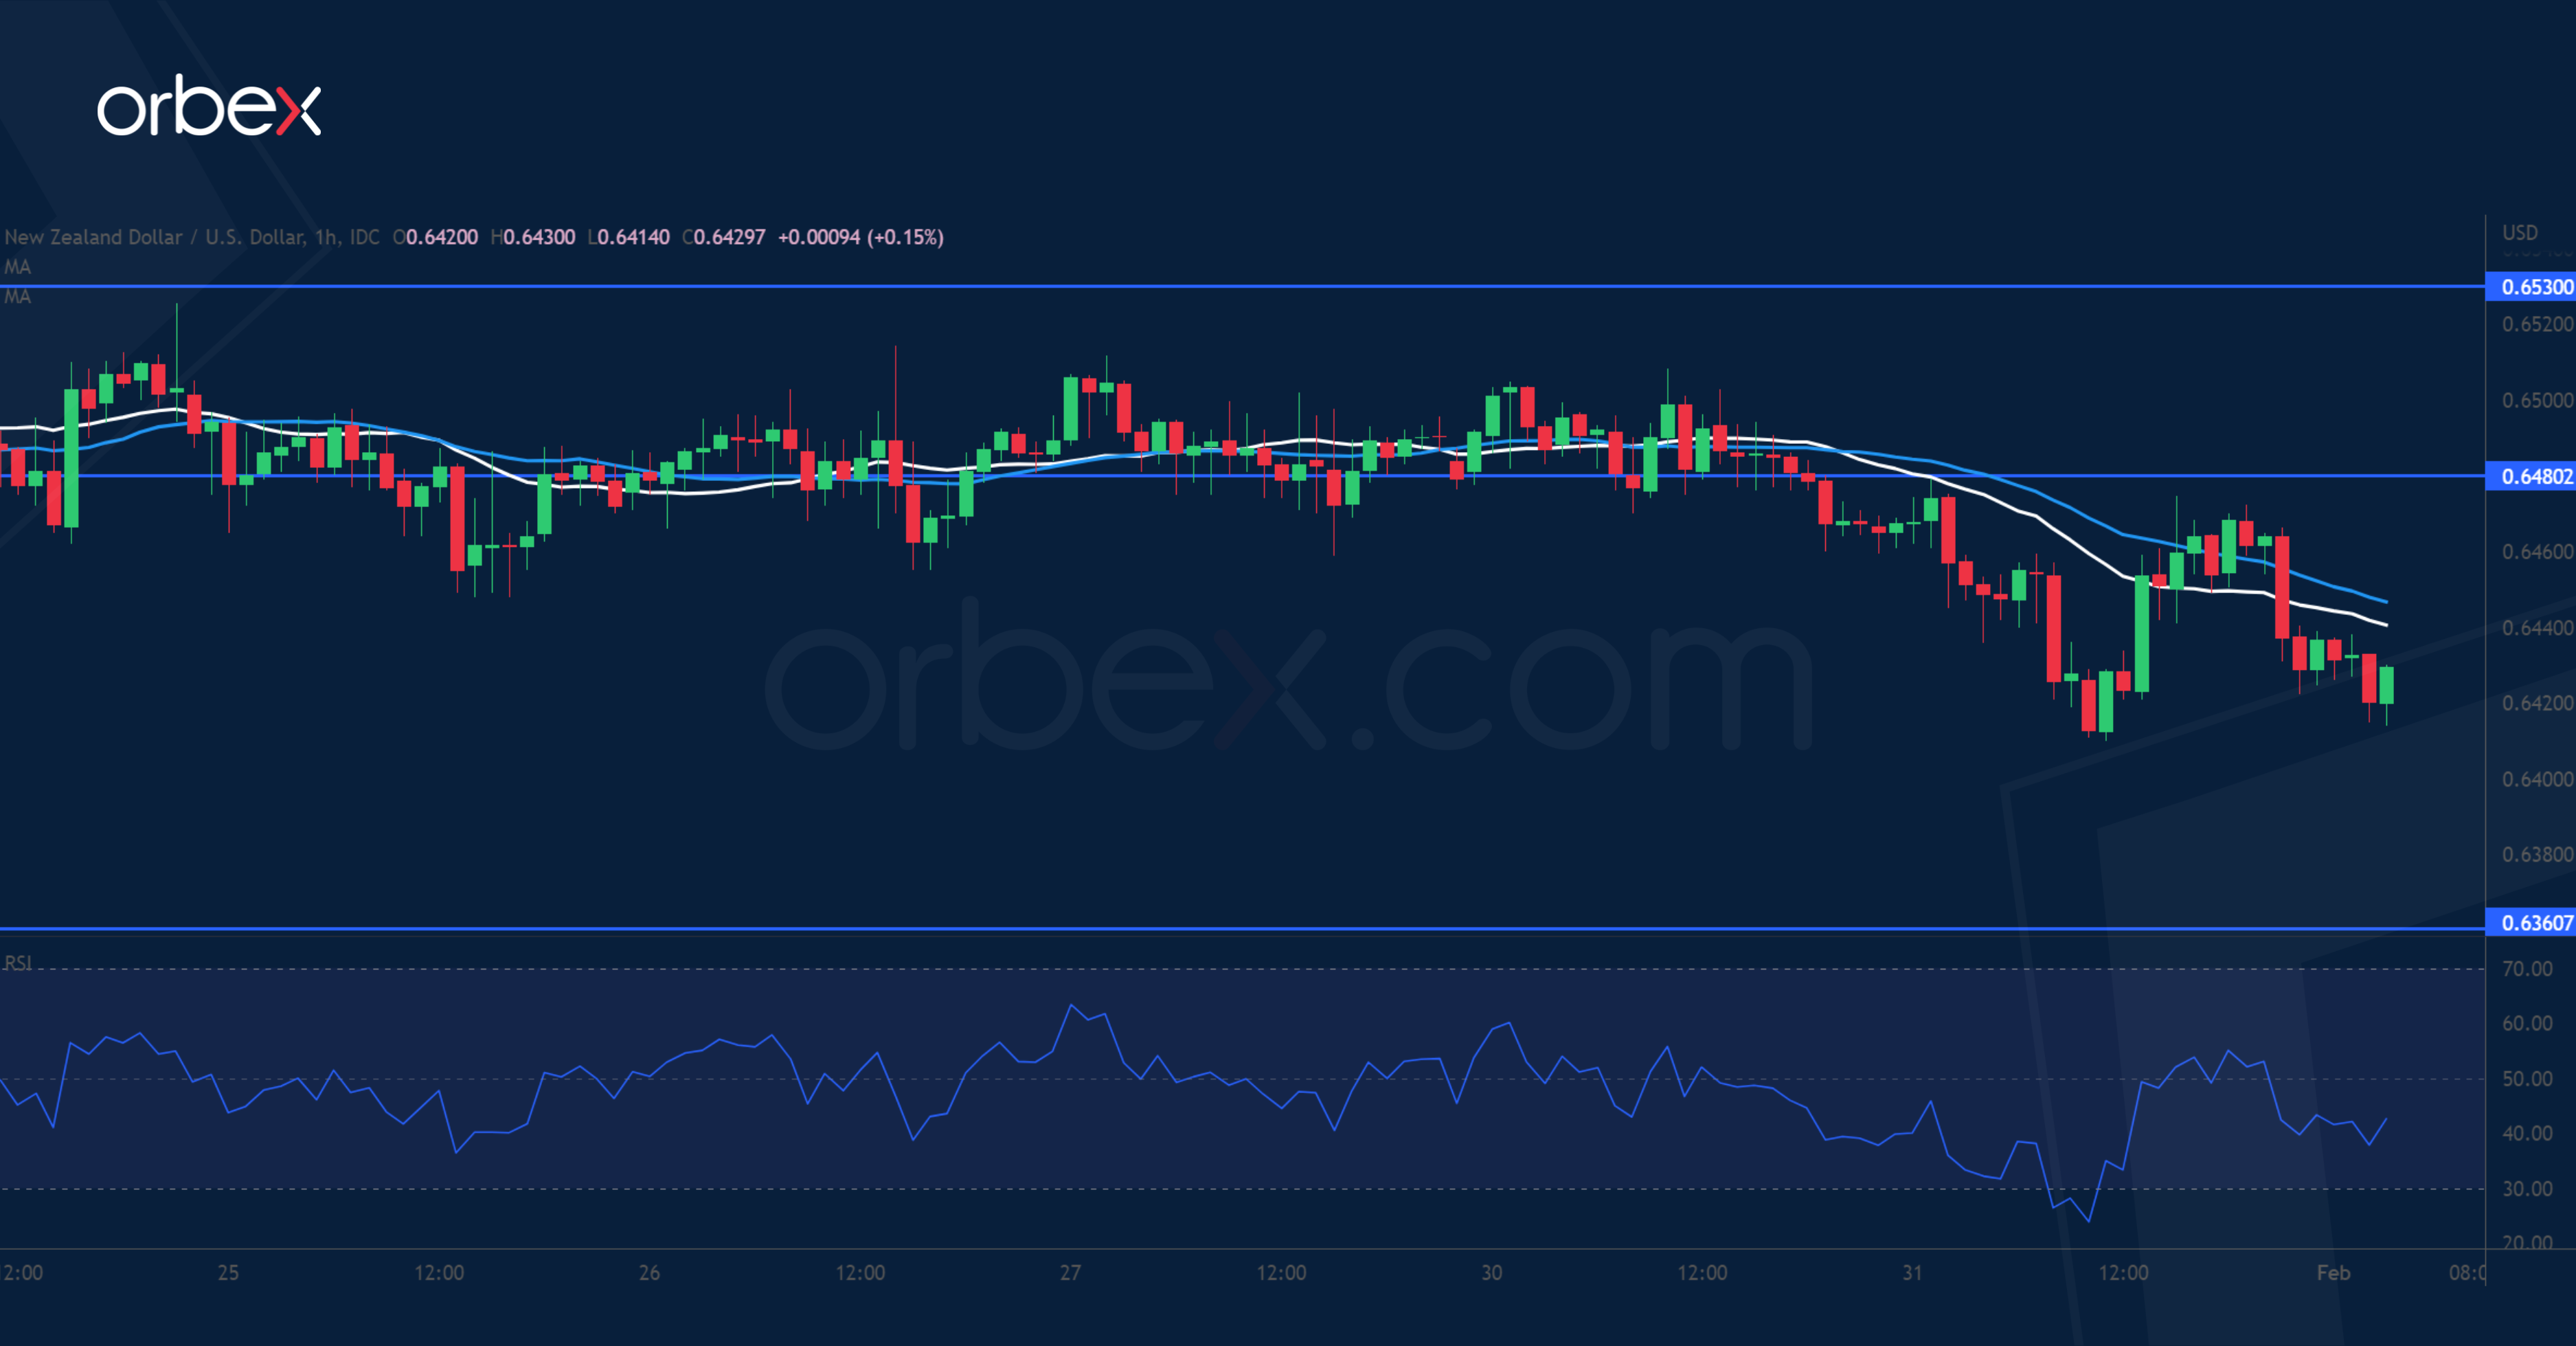
The New Zealand dollar dips as the Q4 unemployment rate disappoints. The pair has been grinding the recent of 0.6530 without success and a break below 0.6440 may prompt some bulls to look for the exit. As the kiwi strives to maintain its lead after clearing 0.6500 on the daily chart, 0.6360 over the 30-day moving average is a key level to expected follow-up interest. The support-turned-resistance at 0.6480 is the first barrier to lift before the uptrend could resume. Otherwise, the gate would be open for a drop below 0.6300.
UK 100 seeks support
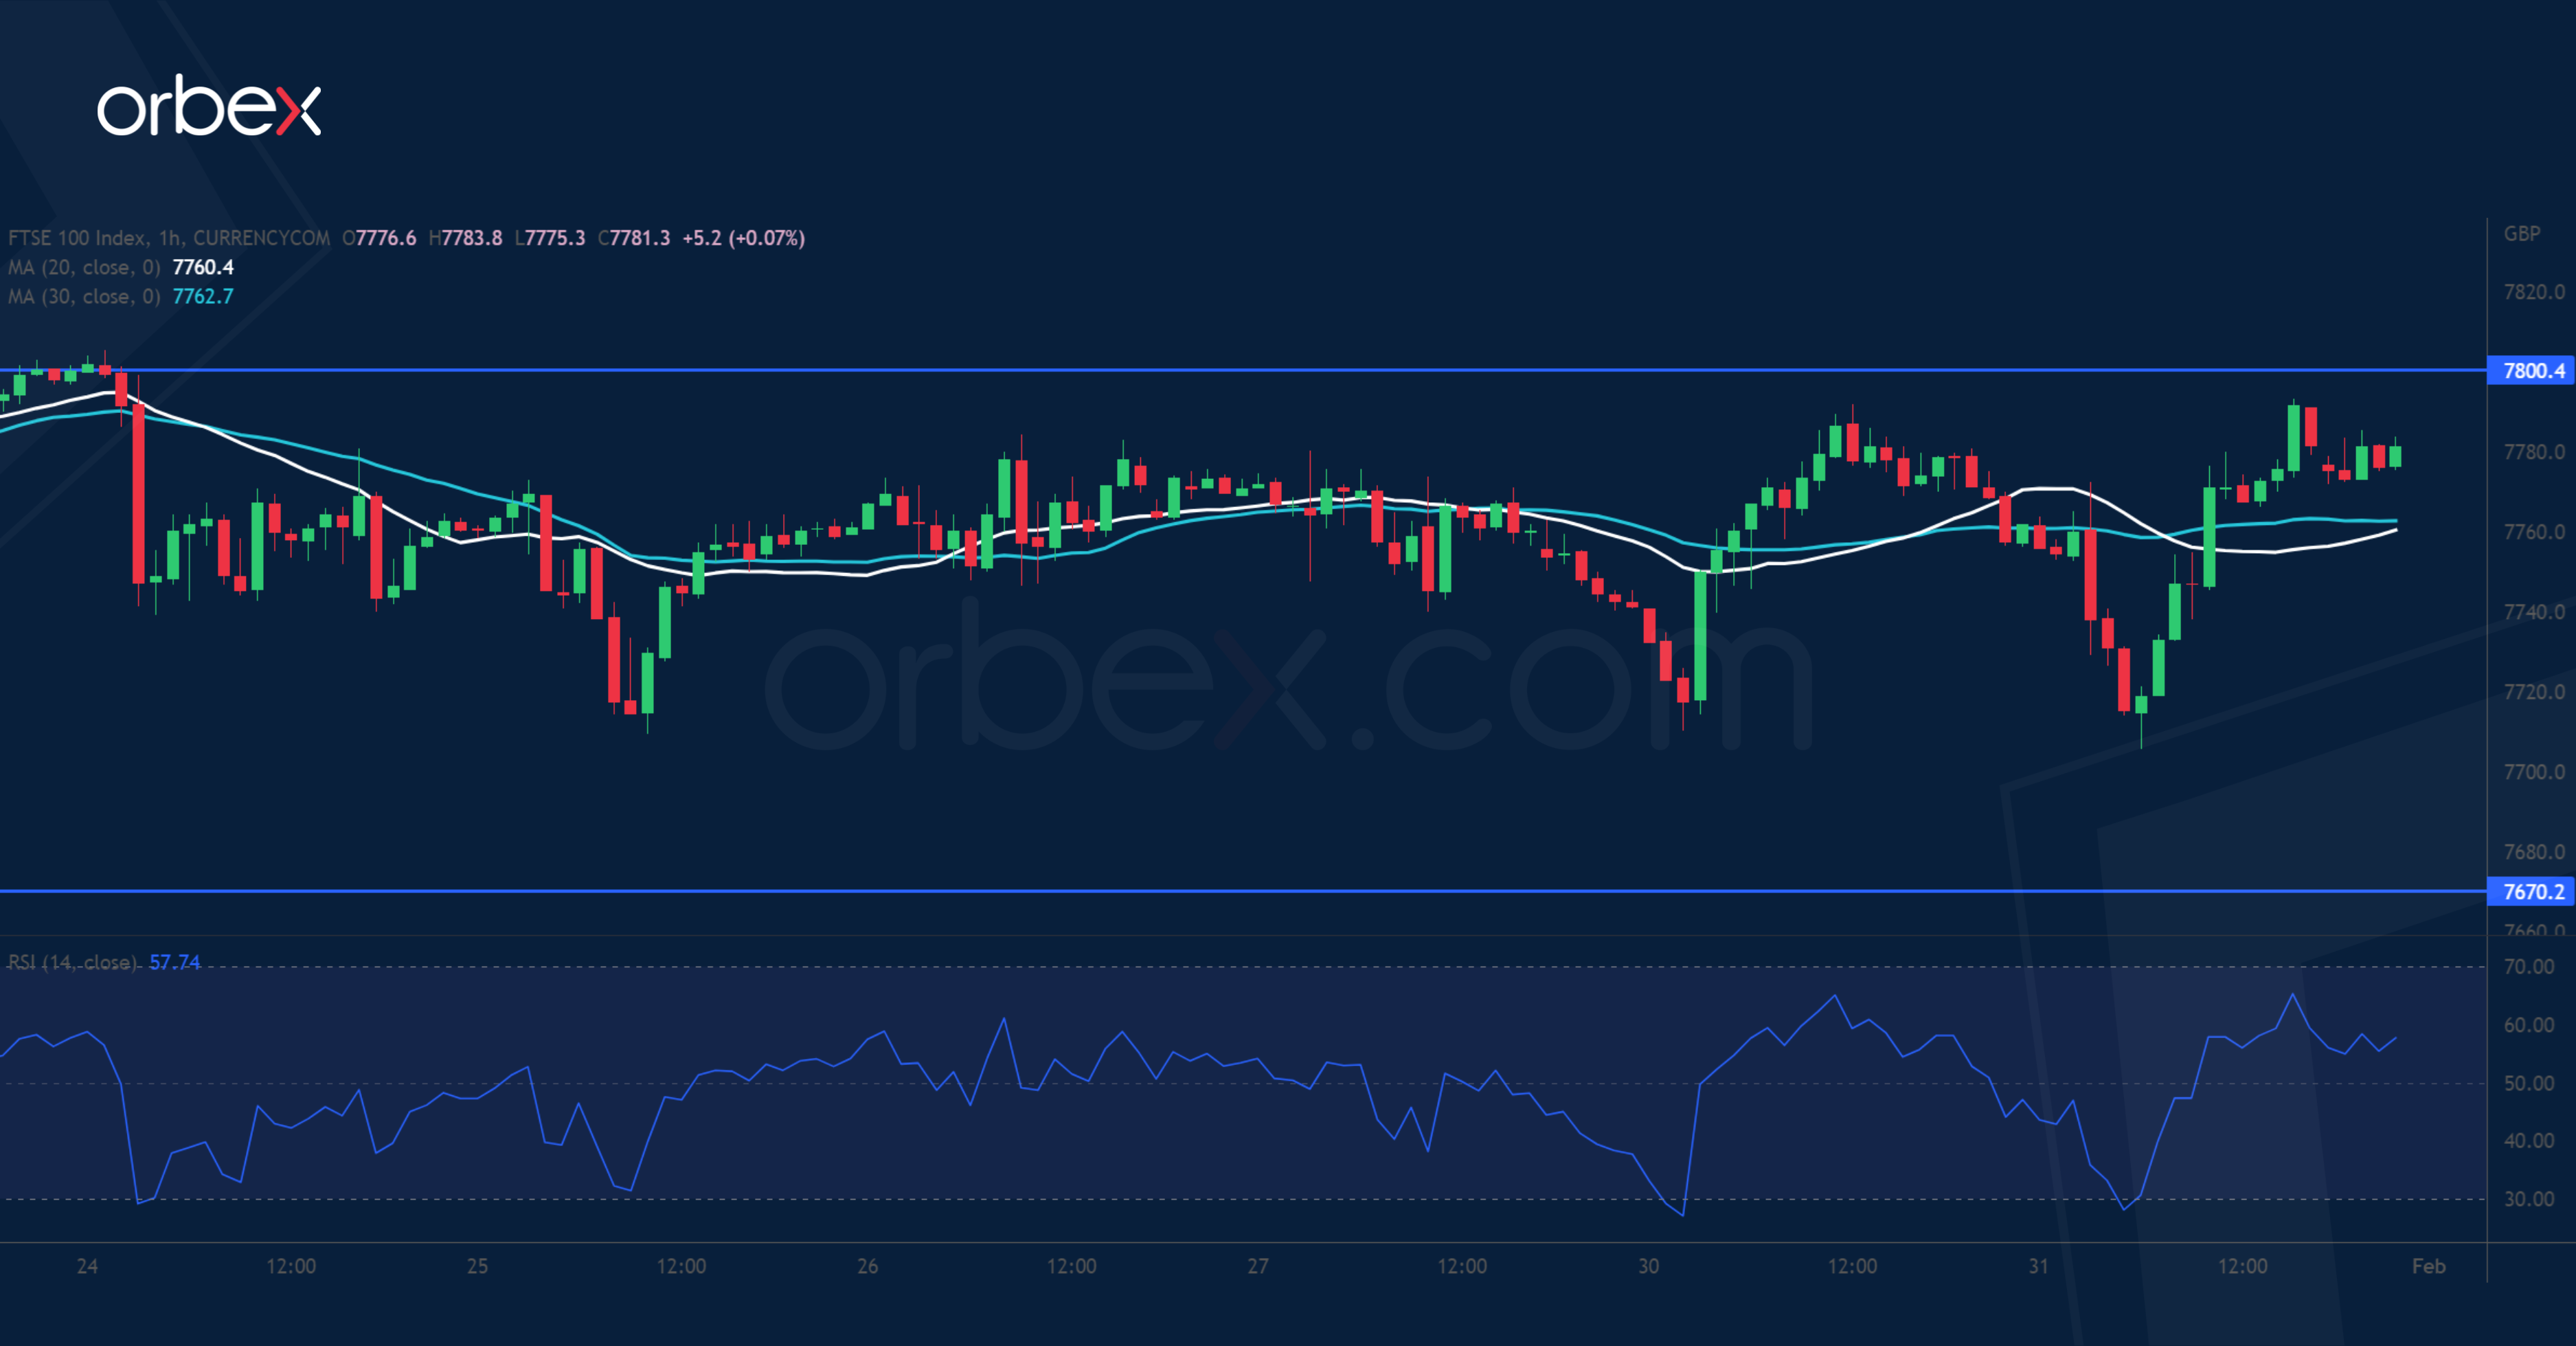
The FTSE 100 treads water ahead of major central bank decisions. The RSI’s double top in the overbought zone is a sign of overextension and the index needs to consolidate after reclaiming last year’s top at 7670. The confluence of a former resistance and the 30-day moving average makes it an important level to gauge the strength underpinning the rally. An oversold RSI on the hourly chart may attract bargain hunters. 7560 is another support in case of a deeper correction. 7800 is the first hurdle before a rebound could gain traction.

![Credit Card 160×600 [EN]](https://assets.iorbex.com/blog/wp-content/uploads/2023/06/13144507/Blog-Banner_EN-Banner_160X600X2.webp)