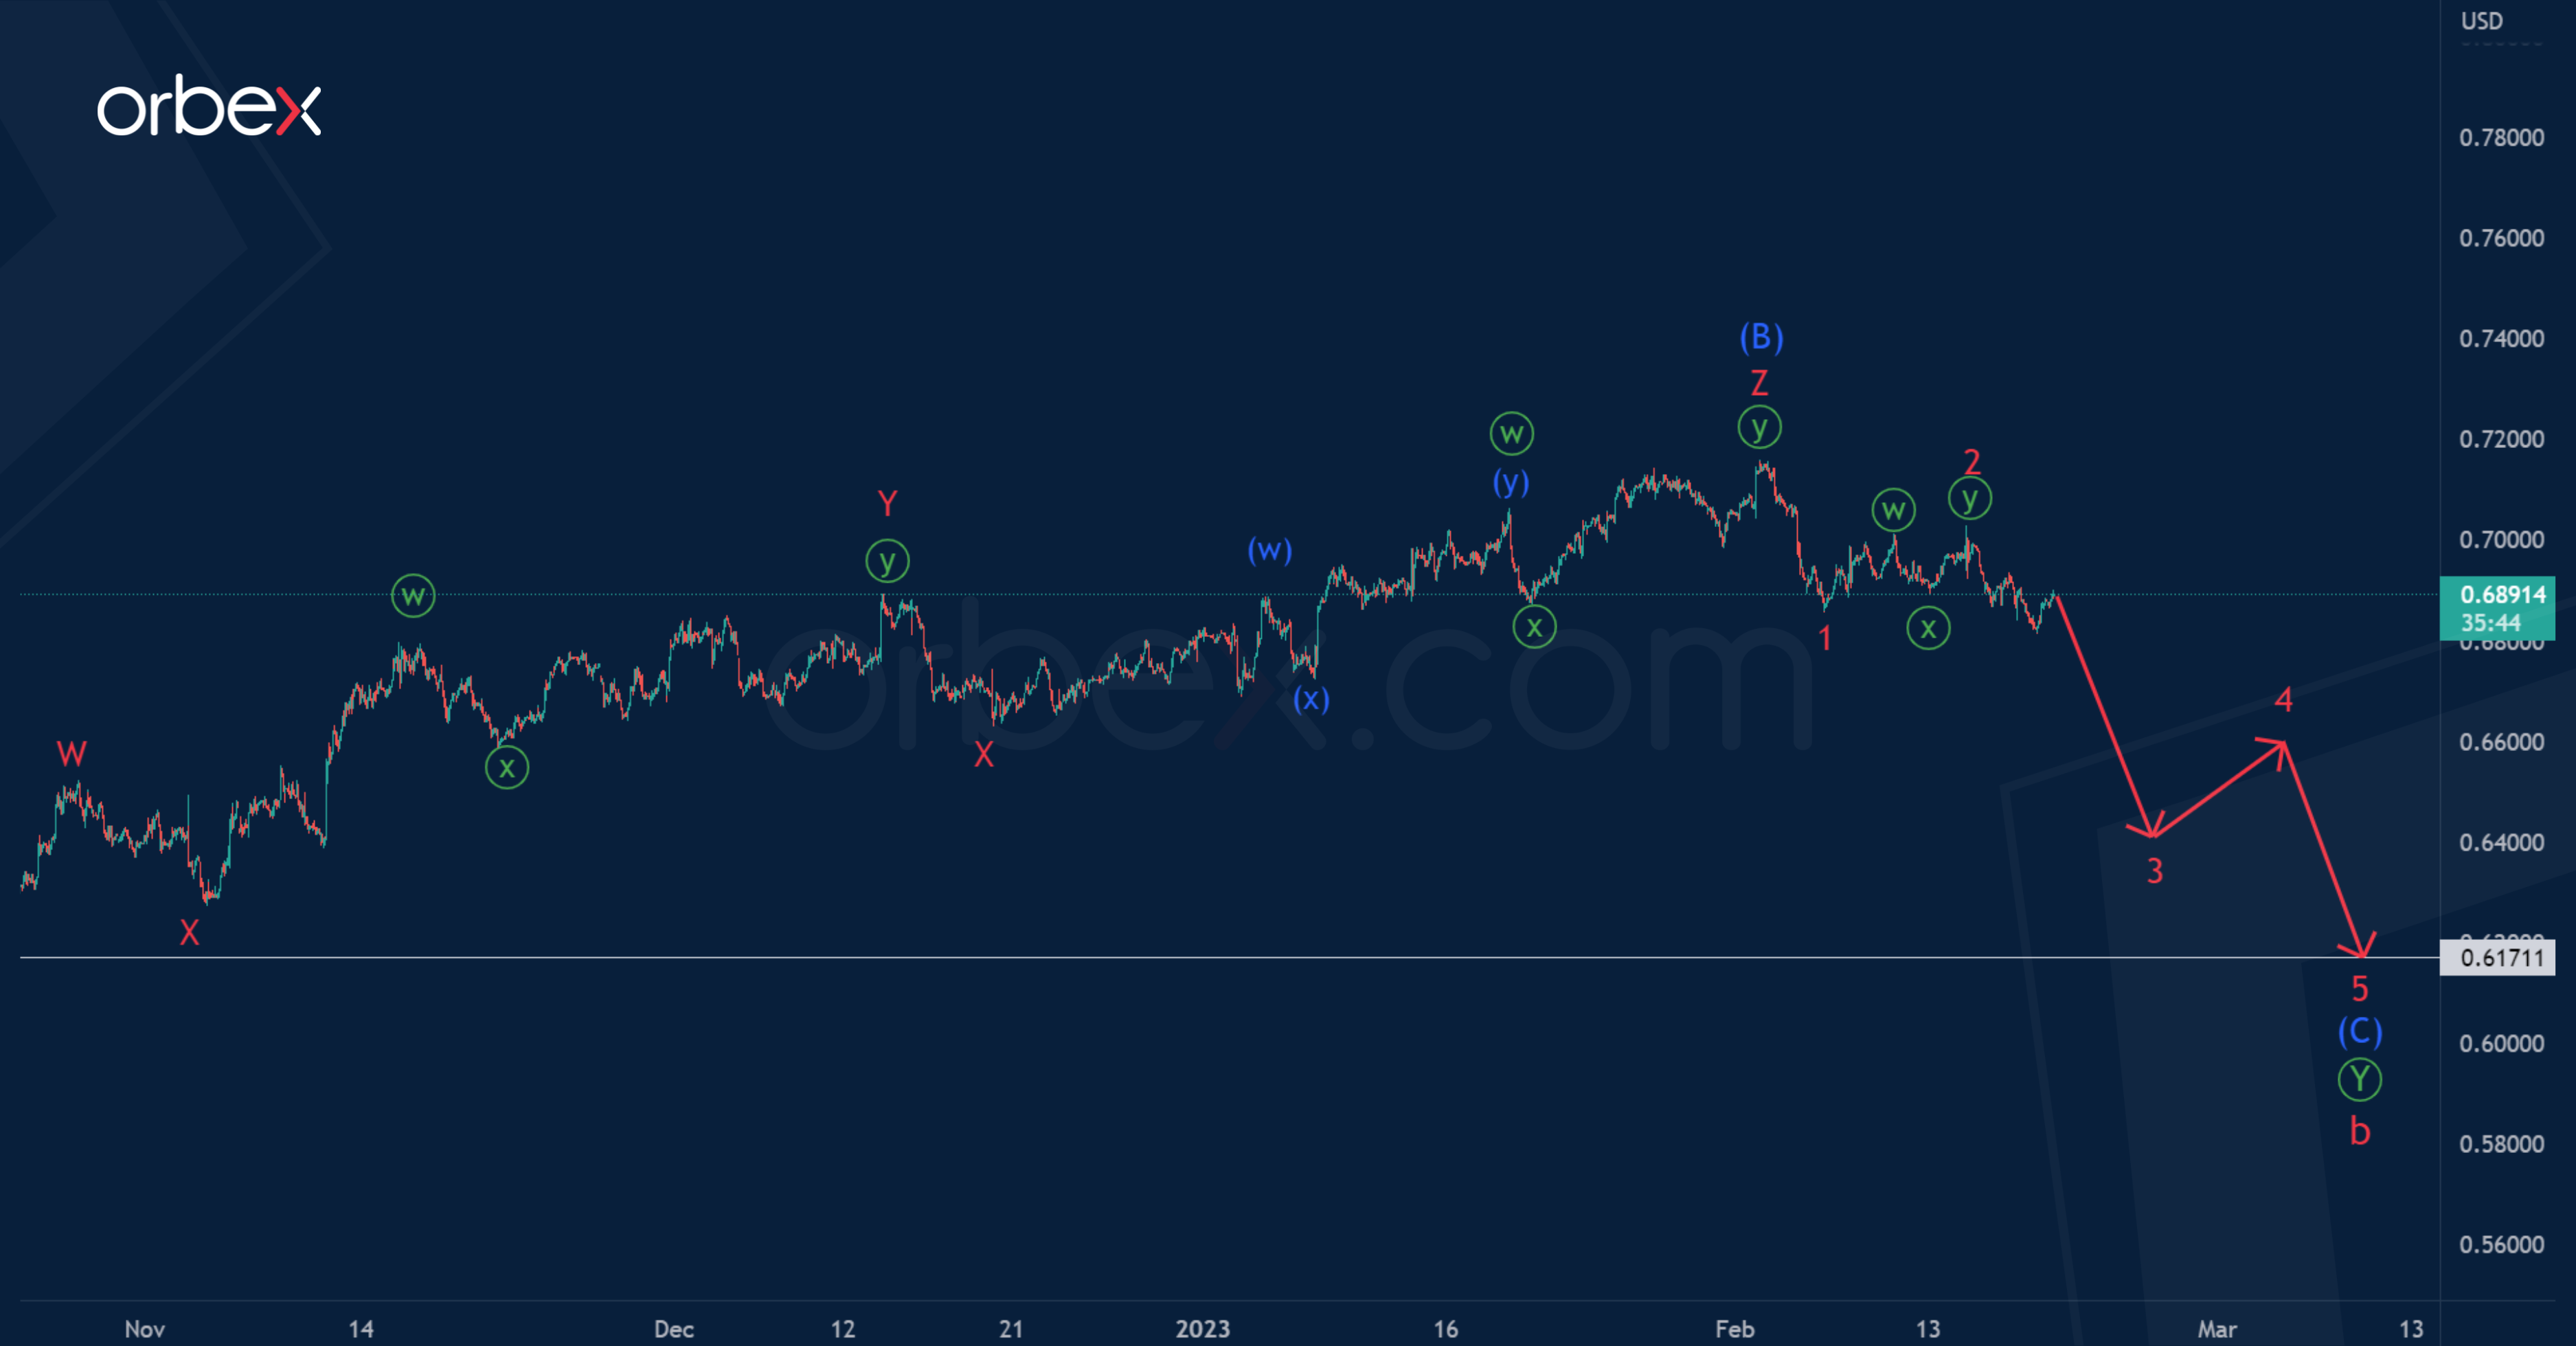
In the long run, AUDUSD seems to be forming a global correction b of the cycle degree. This could soon end in the form of a primary double zigzag Ⓦ-Ⓧ-Ⓨ.
In the zigzag actionary wave, impulse wave (A) and the intermediate correction wave (B) in the form of a triple zigzag have ended.
In the last section of the chart, the initial part of the final impulse (C) has developed. The structure of which is schematically shown by trend lines.

There is a high probability that impulse (C), like the previous impulse (A), will end at a minimum of 0.617.
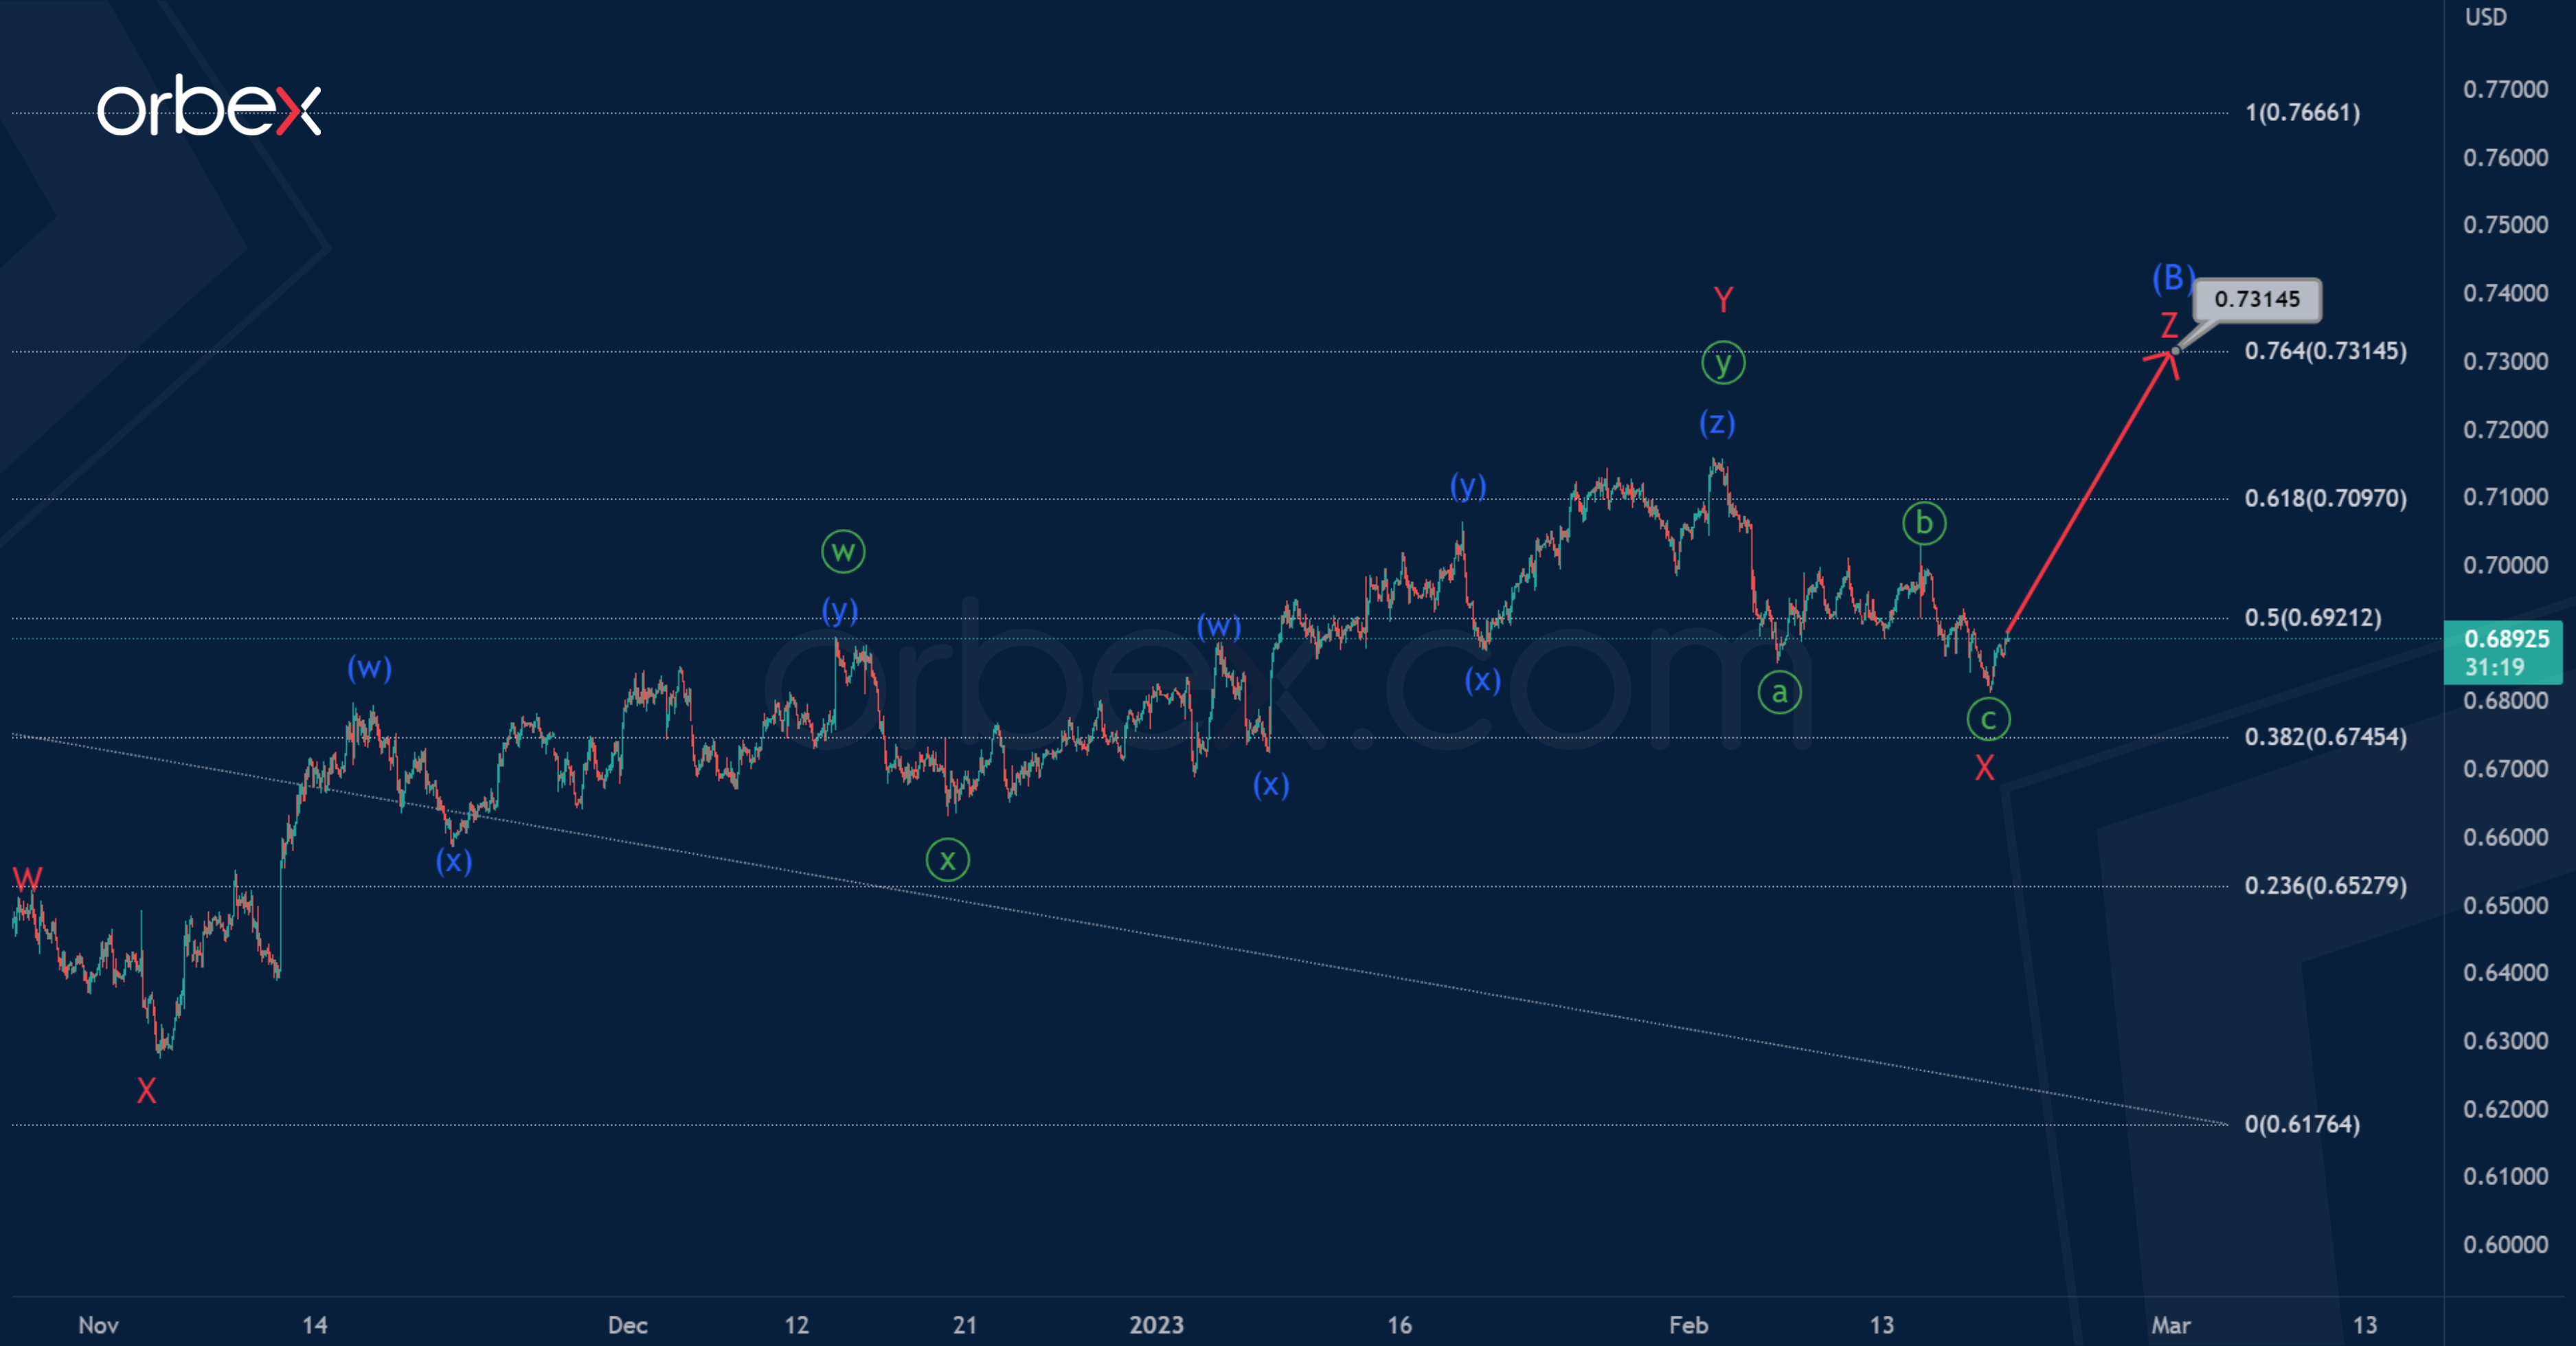
An alternative scenario indicates the continuation of price growth in the intermediate correction (B).
This correction will take the form of a triple zigzag W-X-Y-X-Z, as in the first scenario. However, its is expected to end a little higher.
After the end of the zigzag intervening wave X in the form of a minute zigzag, the price will likely continue to rise in the final minor wave Z to 0.731.
At that level, correction (B) will be at 76.4% of impulse (A).

