
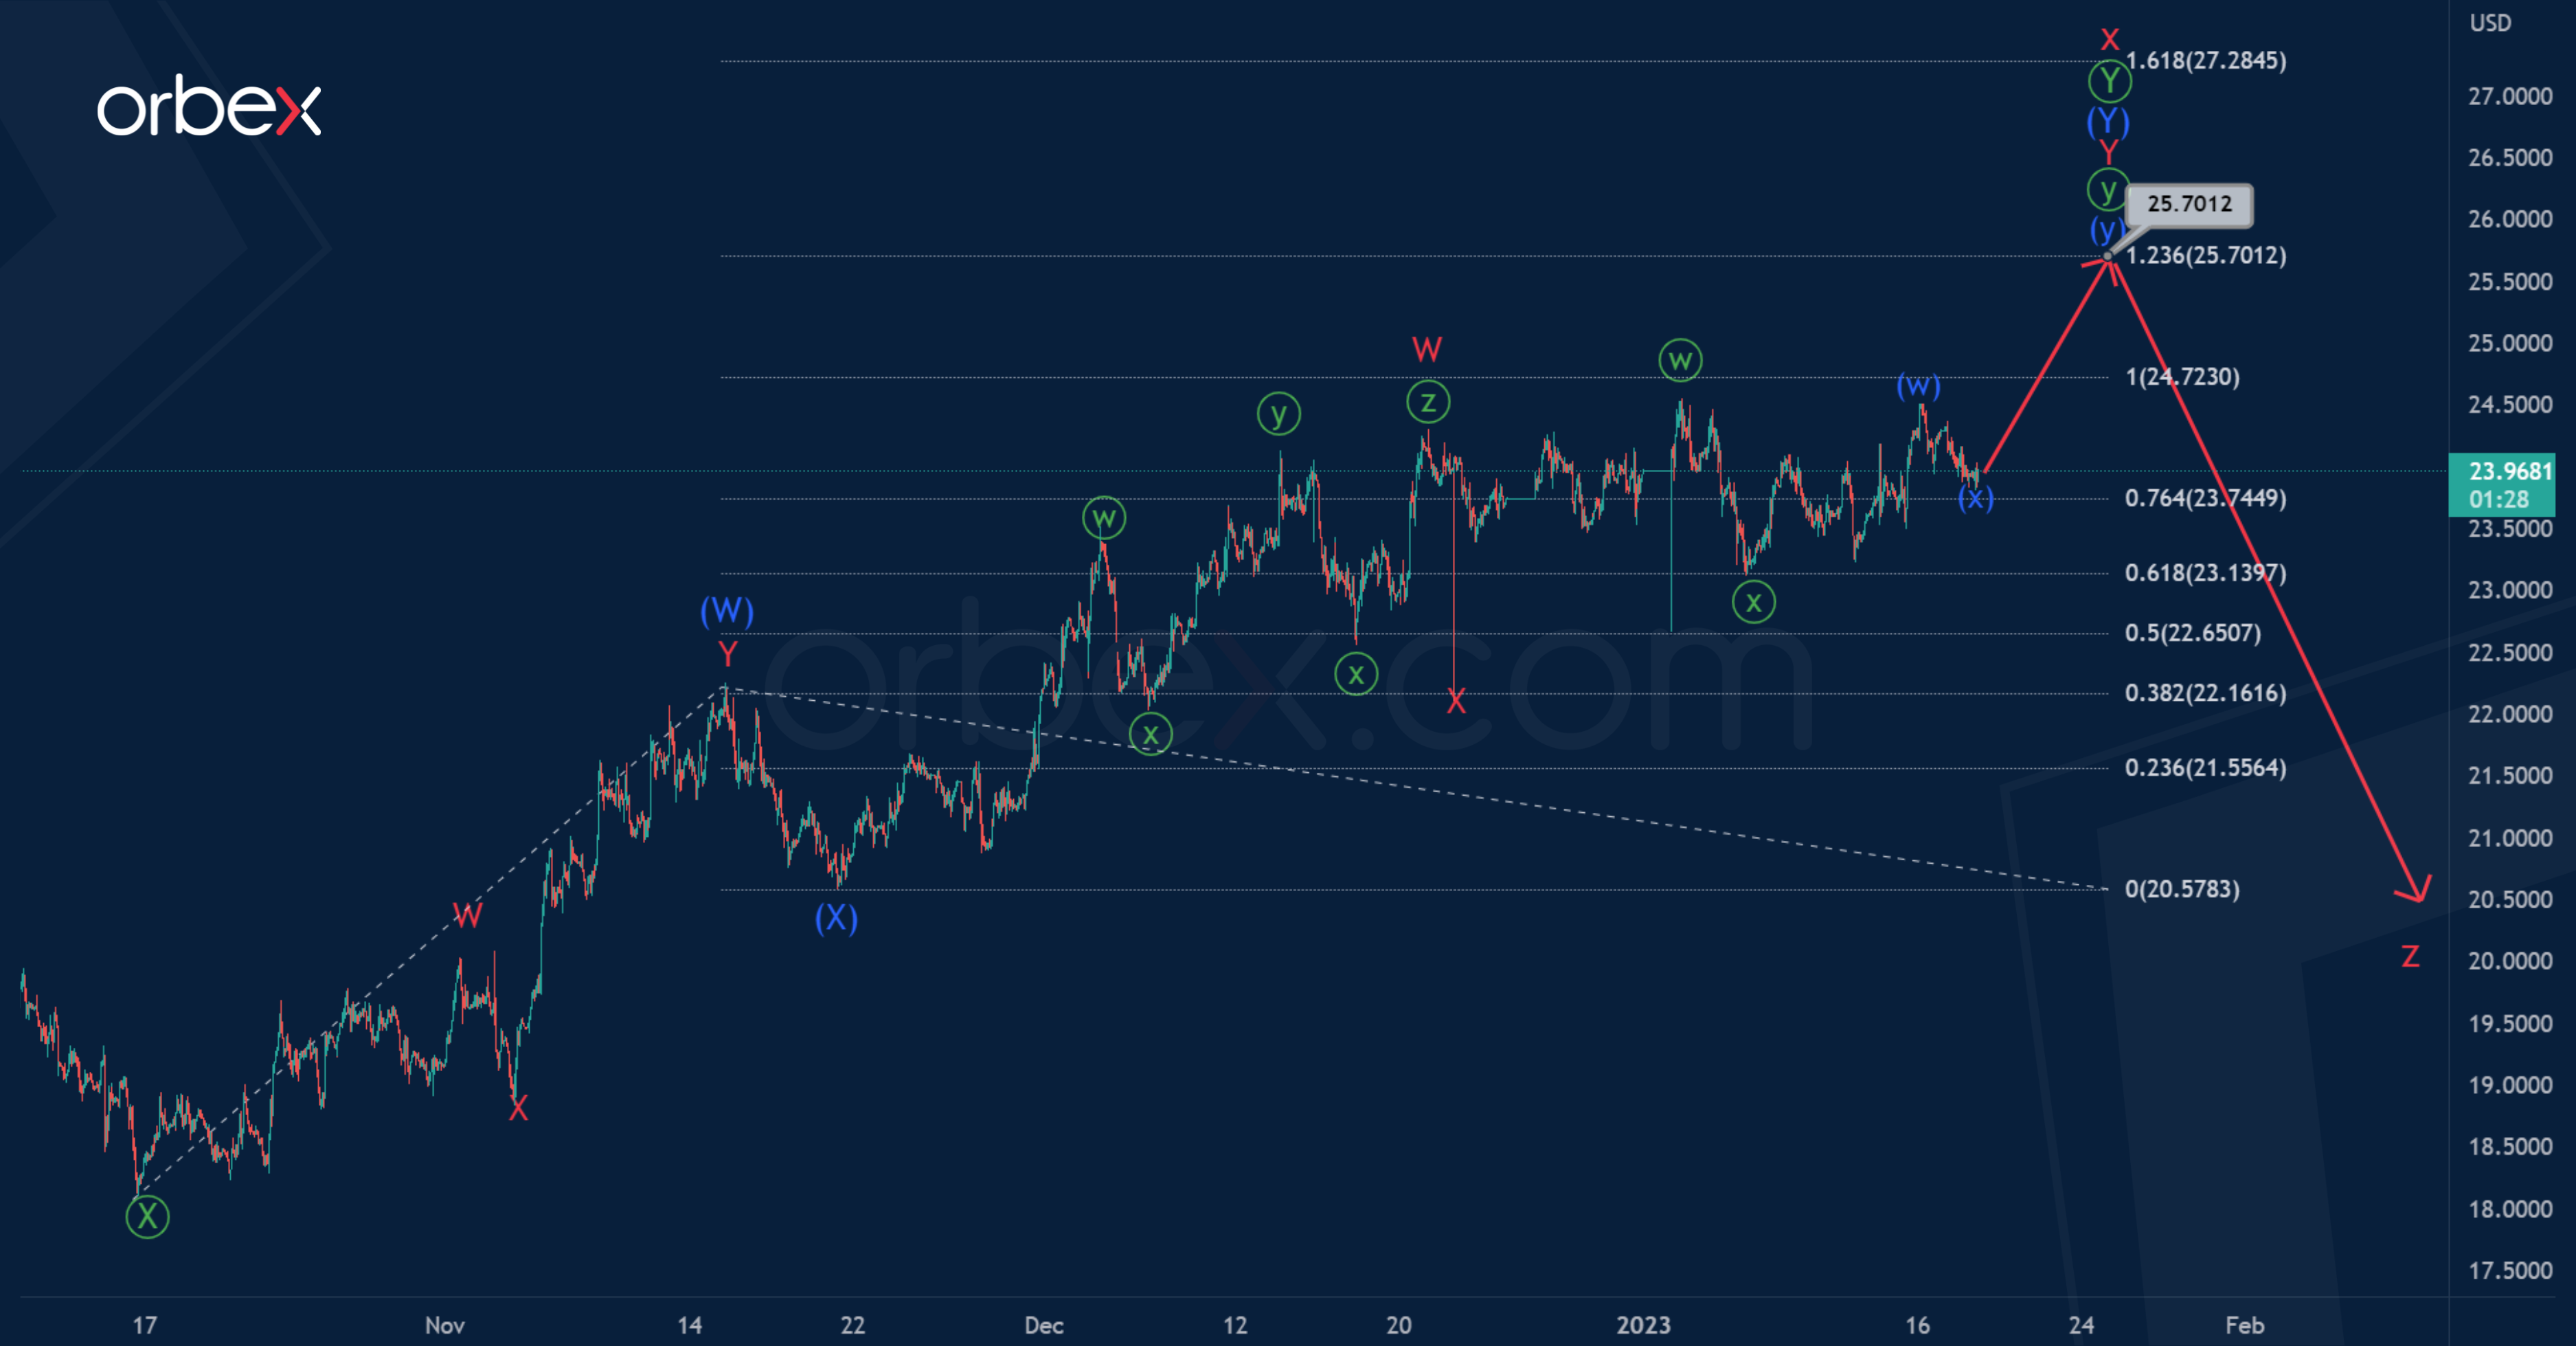
XAGUSD suggests the formation of a global triple zigzag consisting of cycle waves w-x-y-x-z.
The current chart shows the second intervening wave x which could soon end. This could take the form of a double zigzag of the primary degree Ⓦ-Ⓧ-Ⓨ.
The bullish wave Ⓨ consists of intermediate waves (W)-(X)-(Y), where the last sub-wave (Y) has not yet ended.

In the near future, growth will continue within the minor wave Y to 25.701. At that level, intermediate wave (Y) will be at 123.6% of wave (W).
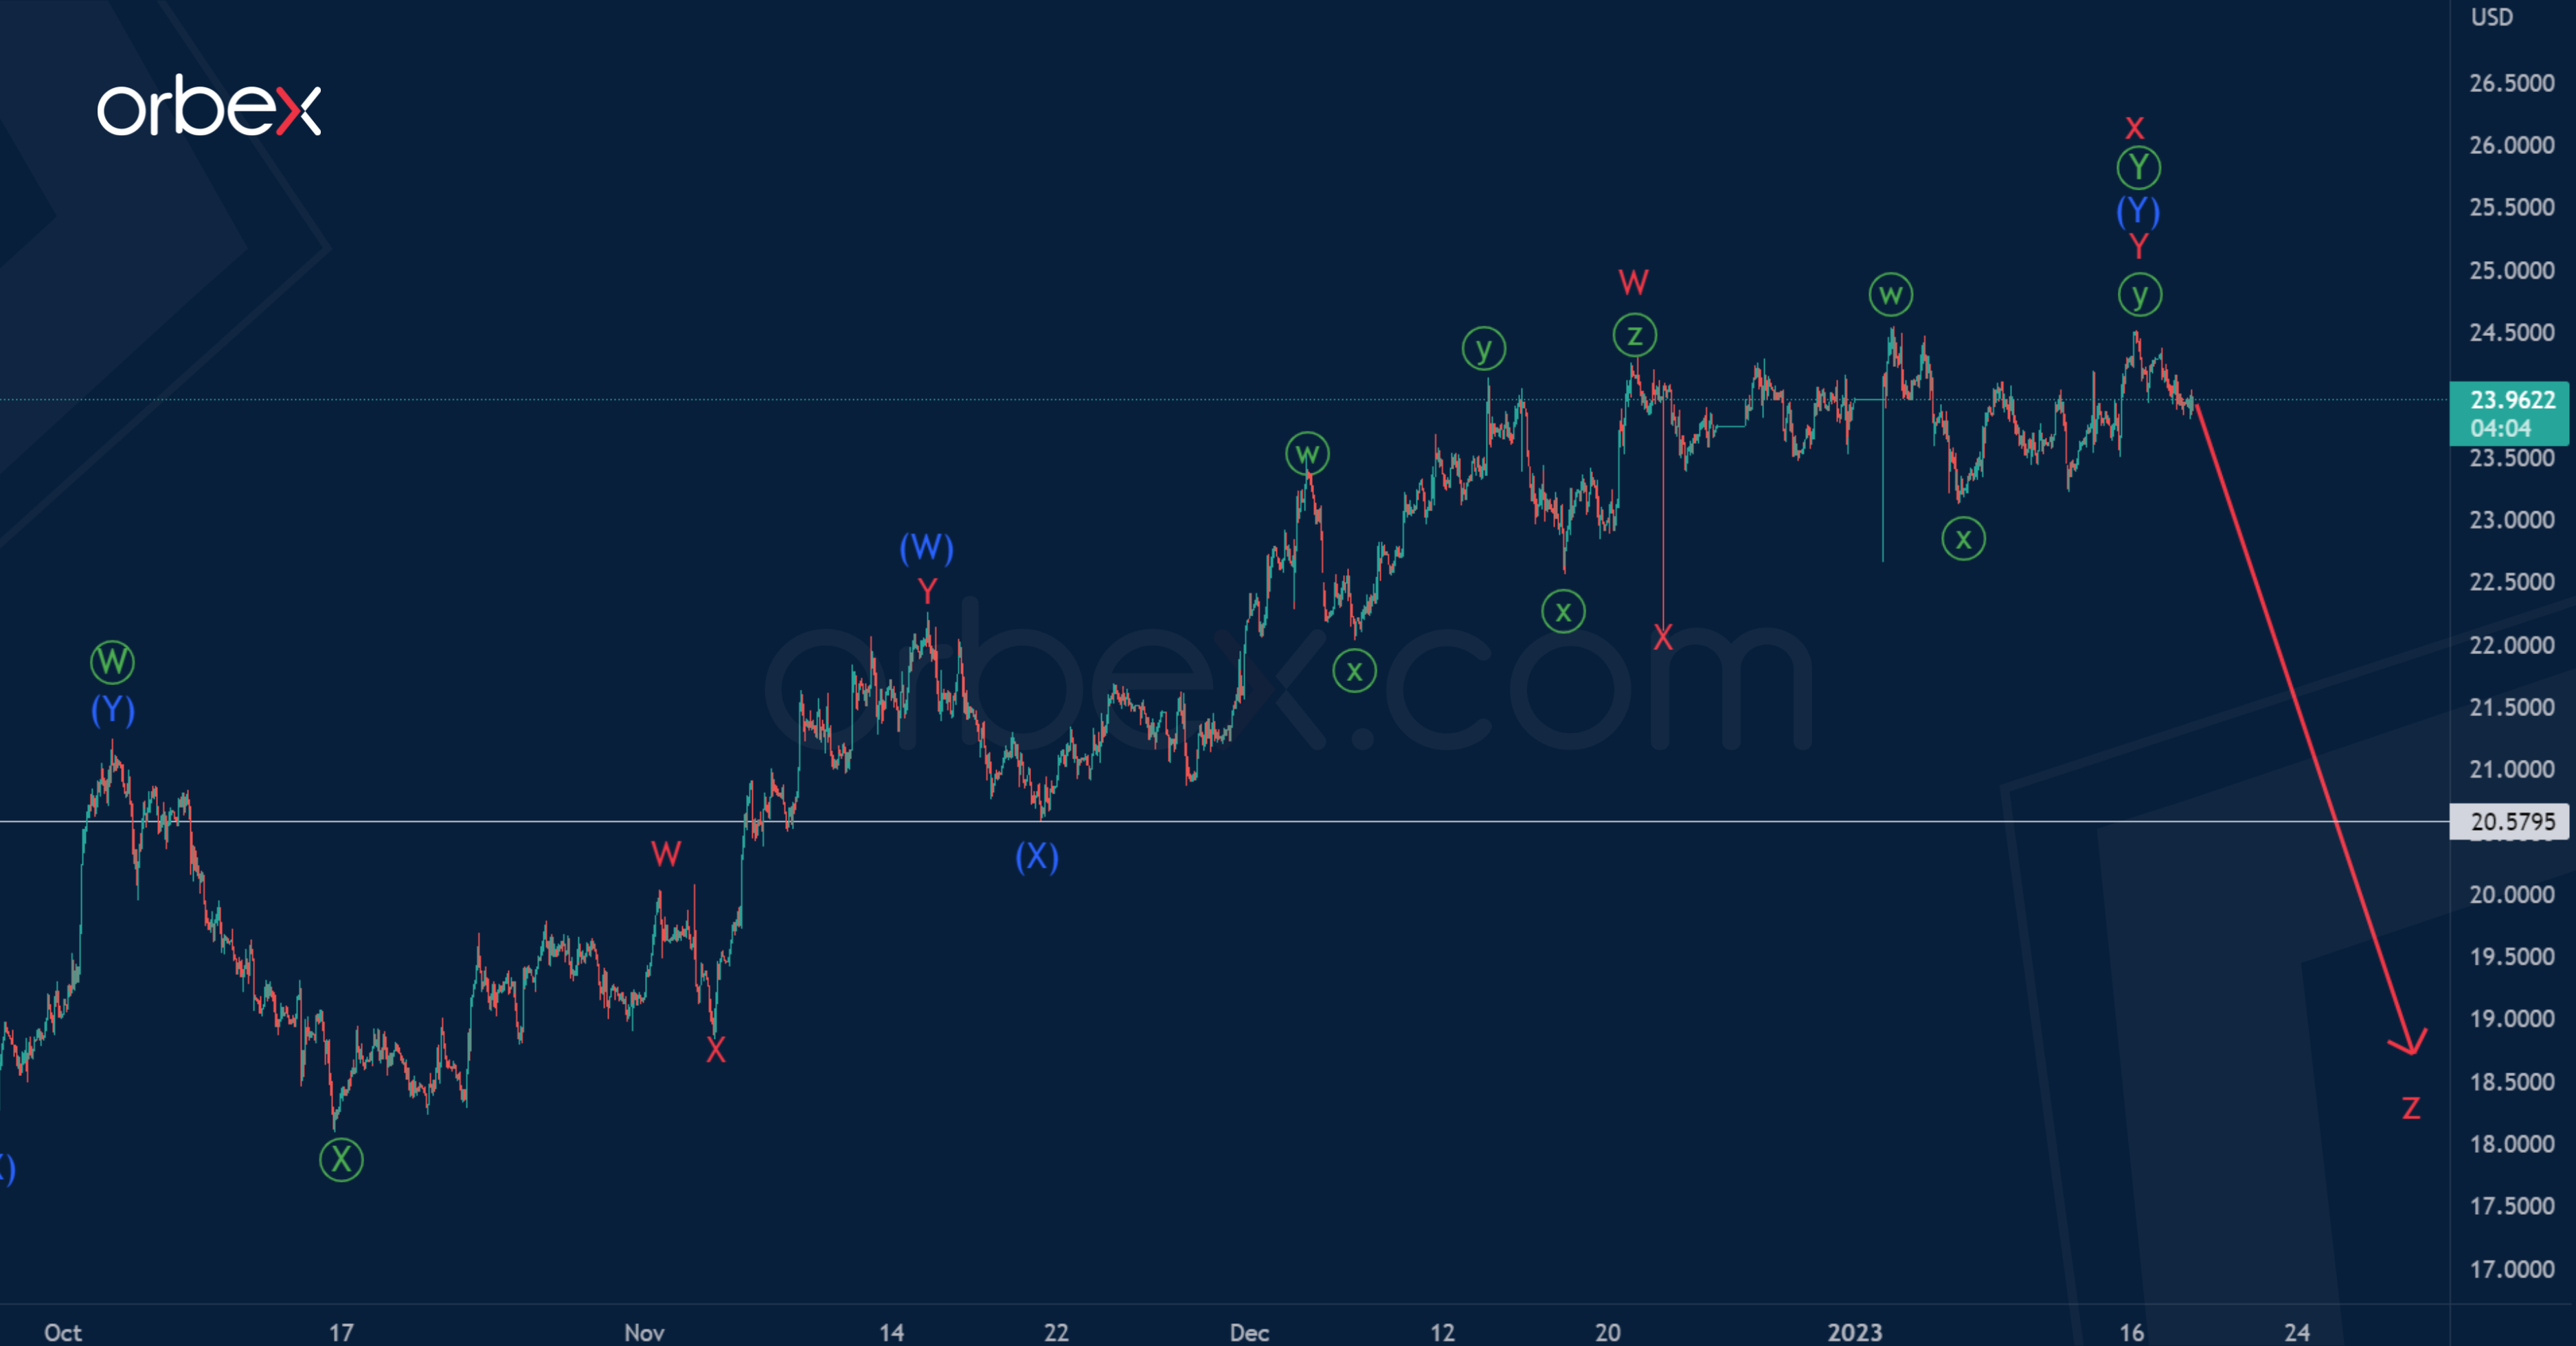
According to the alternative, the cycle intervening wave X formation can already be fully completed.
Its last actionary wave [Y] also looks like a double zigzag (W)-(X)-(Y). The minute sub-waves ⓦ and ⓨ are completed at the same level.
Thus, in the last section we see the initial part of a new bearish wave z of the cycle degree.
If this option is confirmed, prices could drop to 20.579, and then even lower.

