
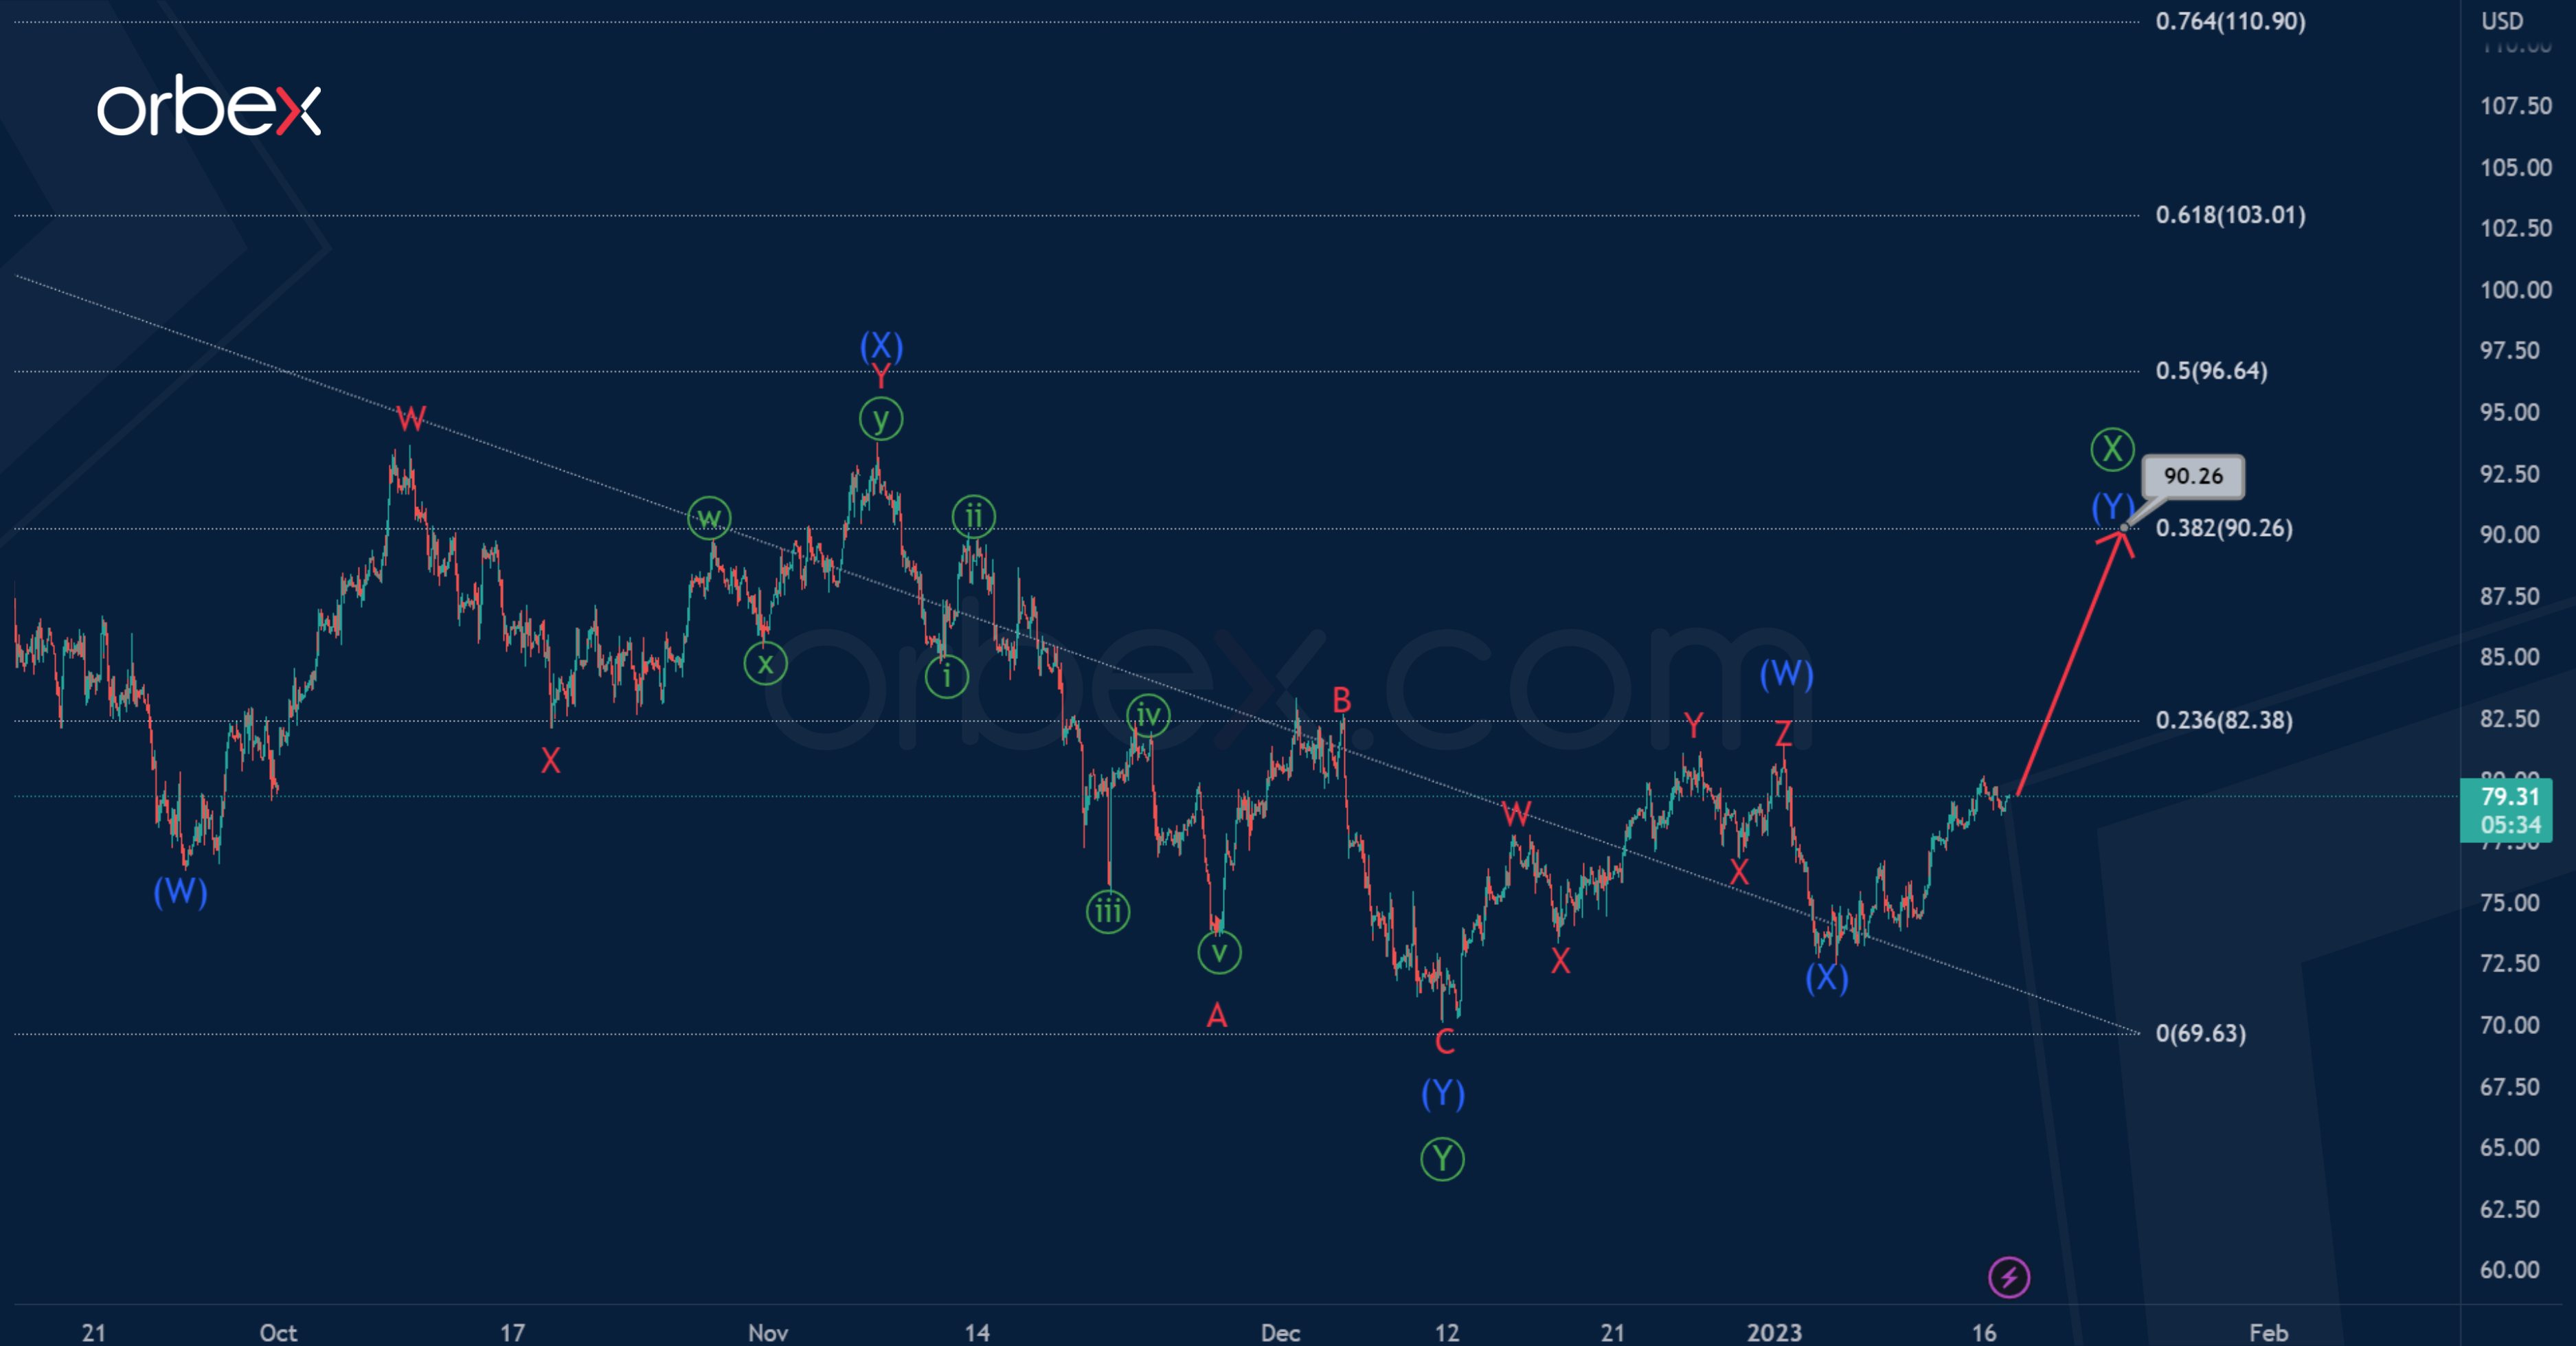
USOIL suggests the formation of a triple zigzag pattern Ⓦ-Ⓧ-Ⓨ-Ⓧ-Ⓩ. The primary waves Ⓦ-Ⓧ-Ⓨ seem to be fully completed.
In the last section of the chart, we see the formation of an ascending primary intervening wave Ⓧ. This takes the form of an intermediate double zigzag (W)-(X)-(Y).
The final wave (Y) will likely end near 90.26. At that level, wave Ⓧ will be at 38.2% of primary wave Ⓨ.

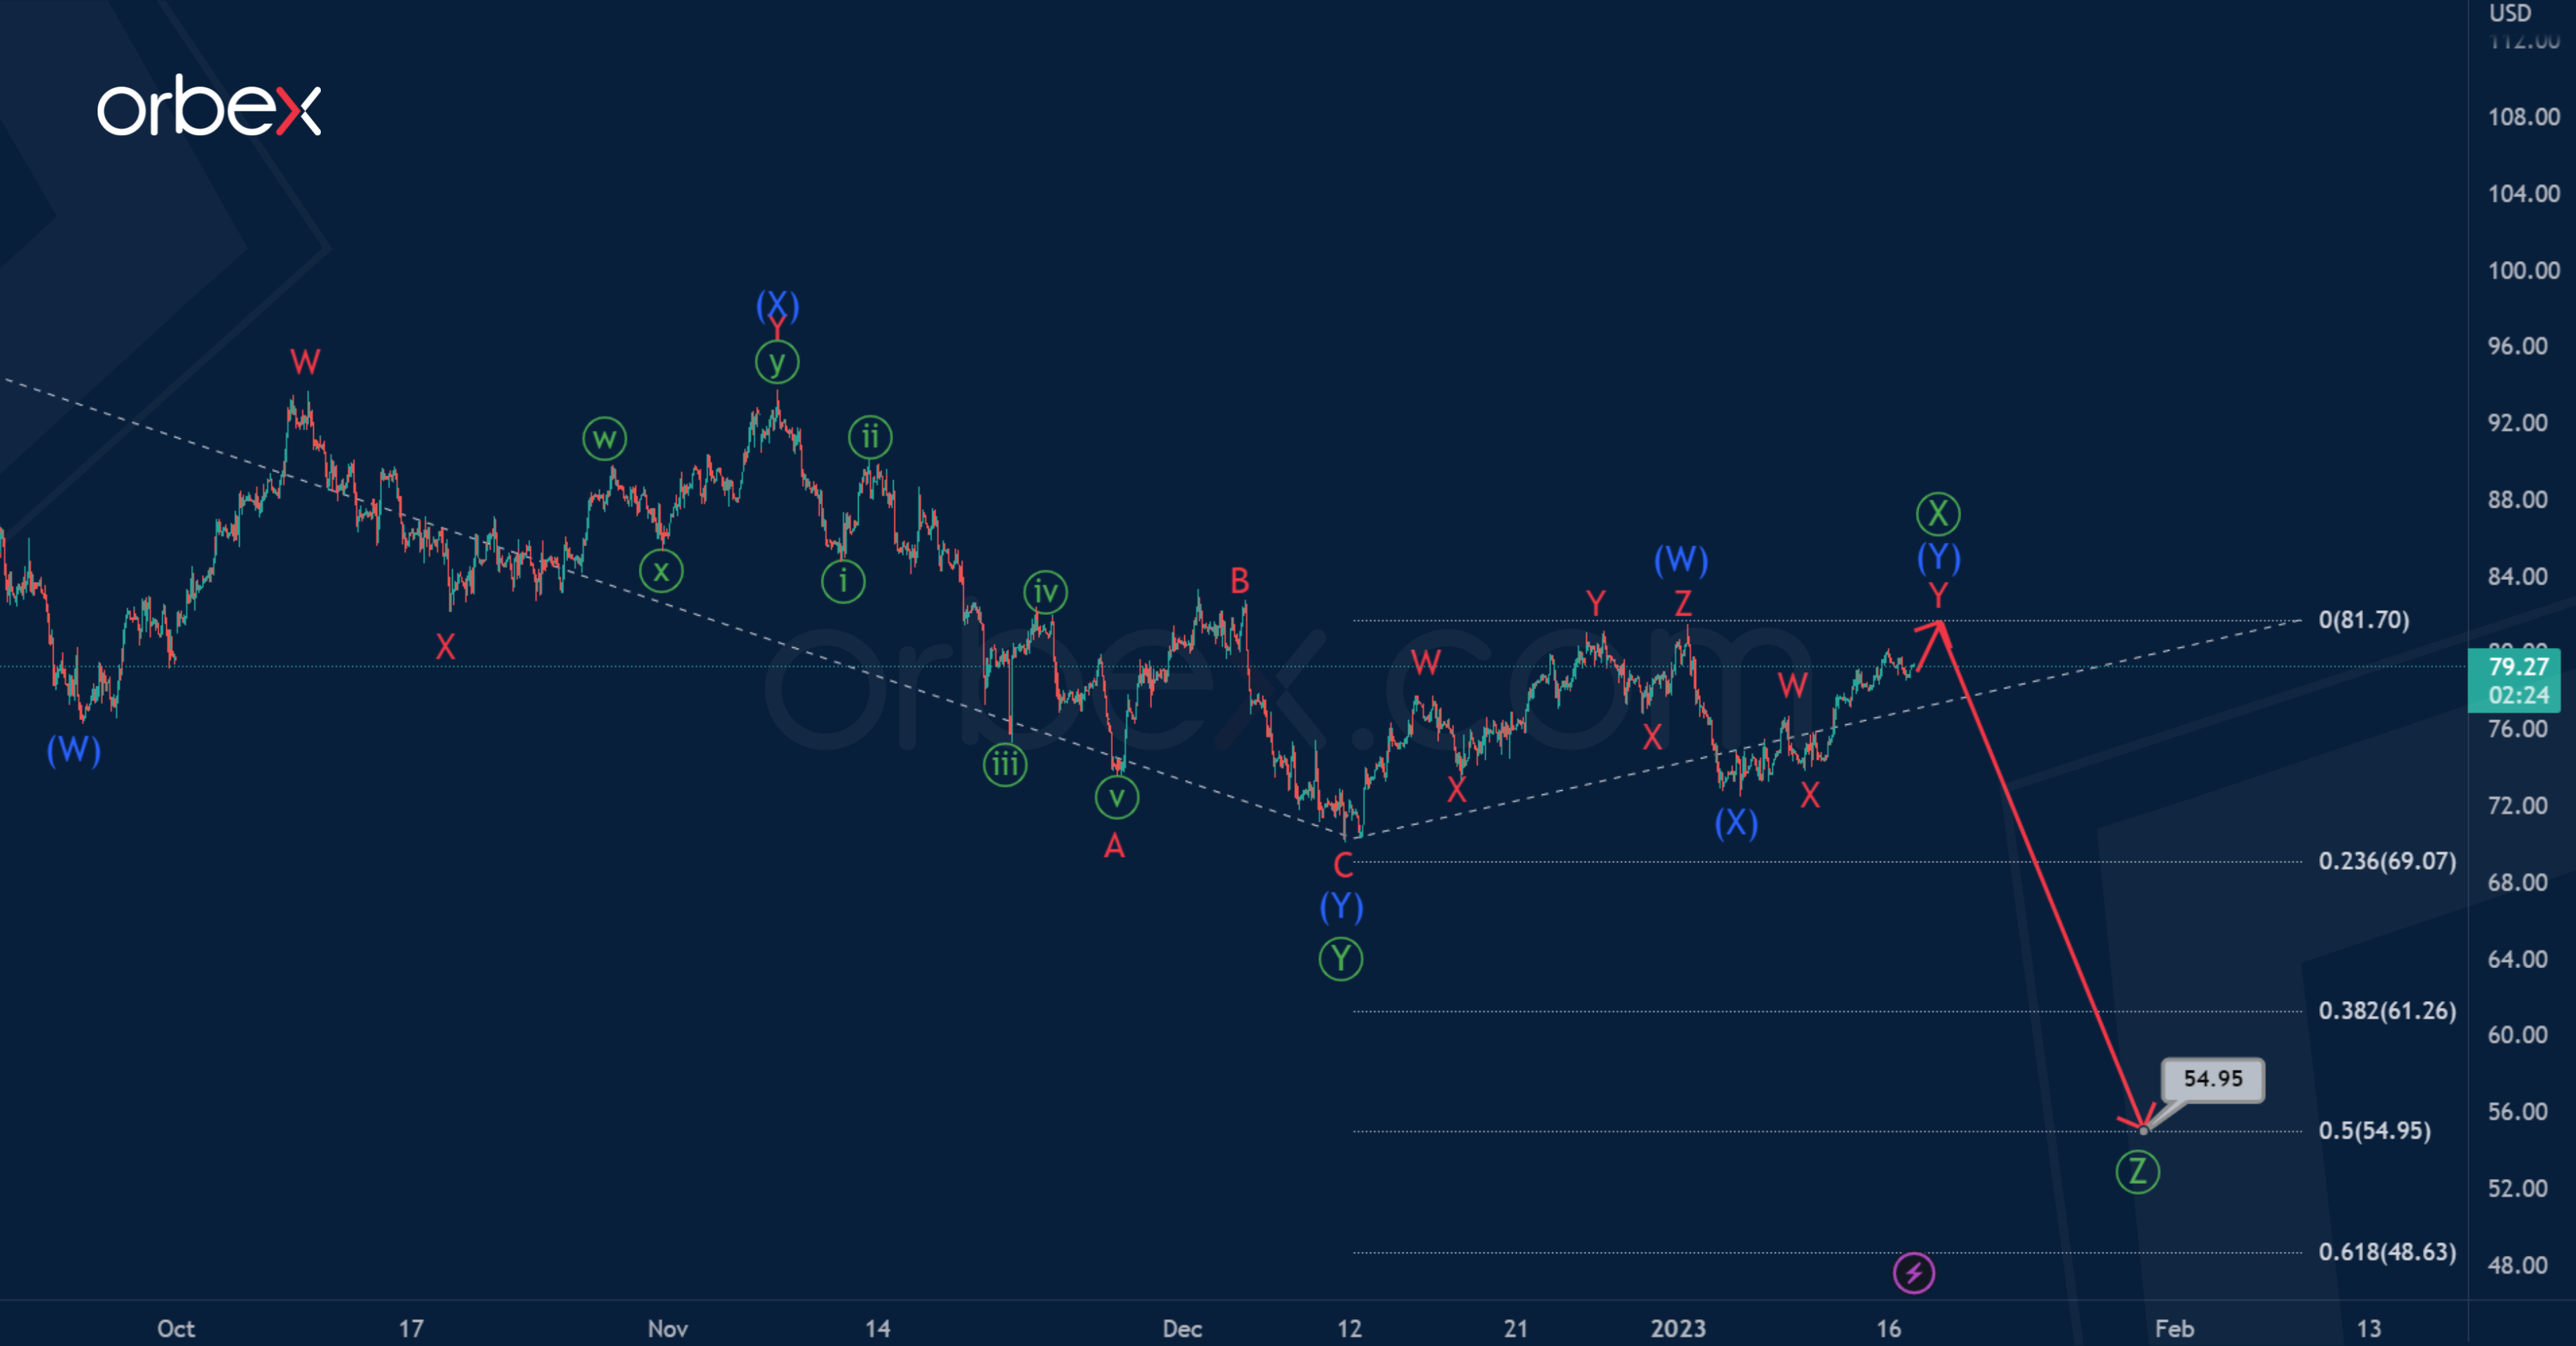
An alternative scenario assumes that the intervening wave Ⓧ will end at the previous high of 81.70. Then the market will turn around.
In the very near future we will observe the decline and development of the primary actionary wave Ⓩ.
There is a high probability that the bearish trend will continue to 54.95. At that level, primary wave Ⓩ will be equal to half of wave Ⓨ.

