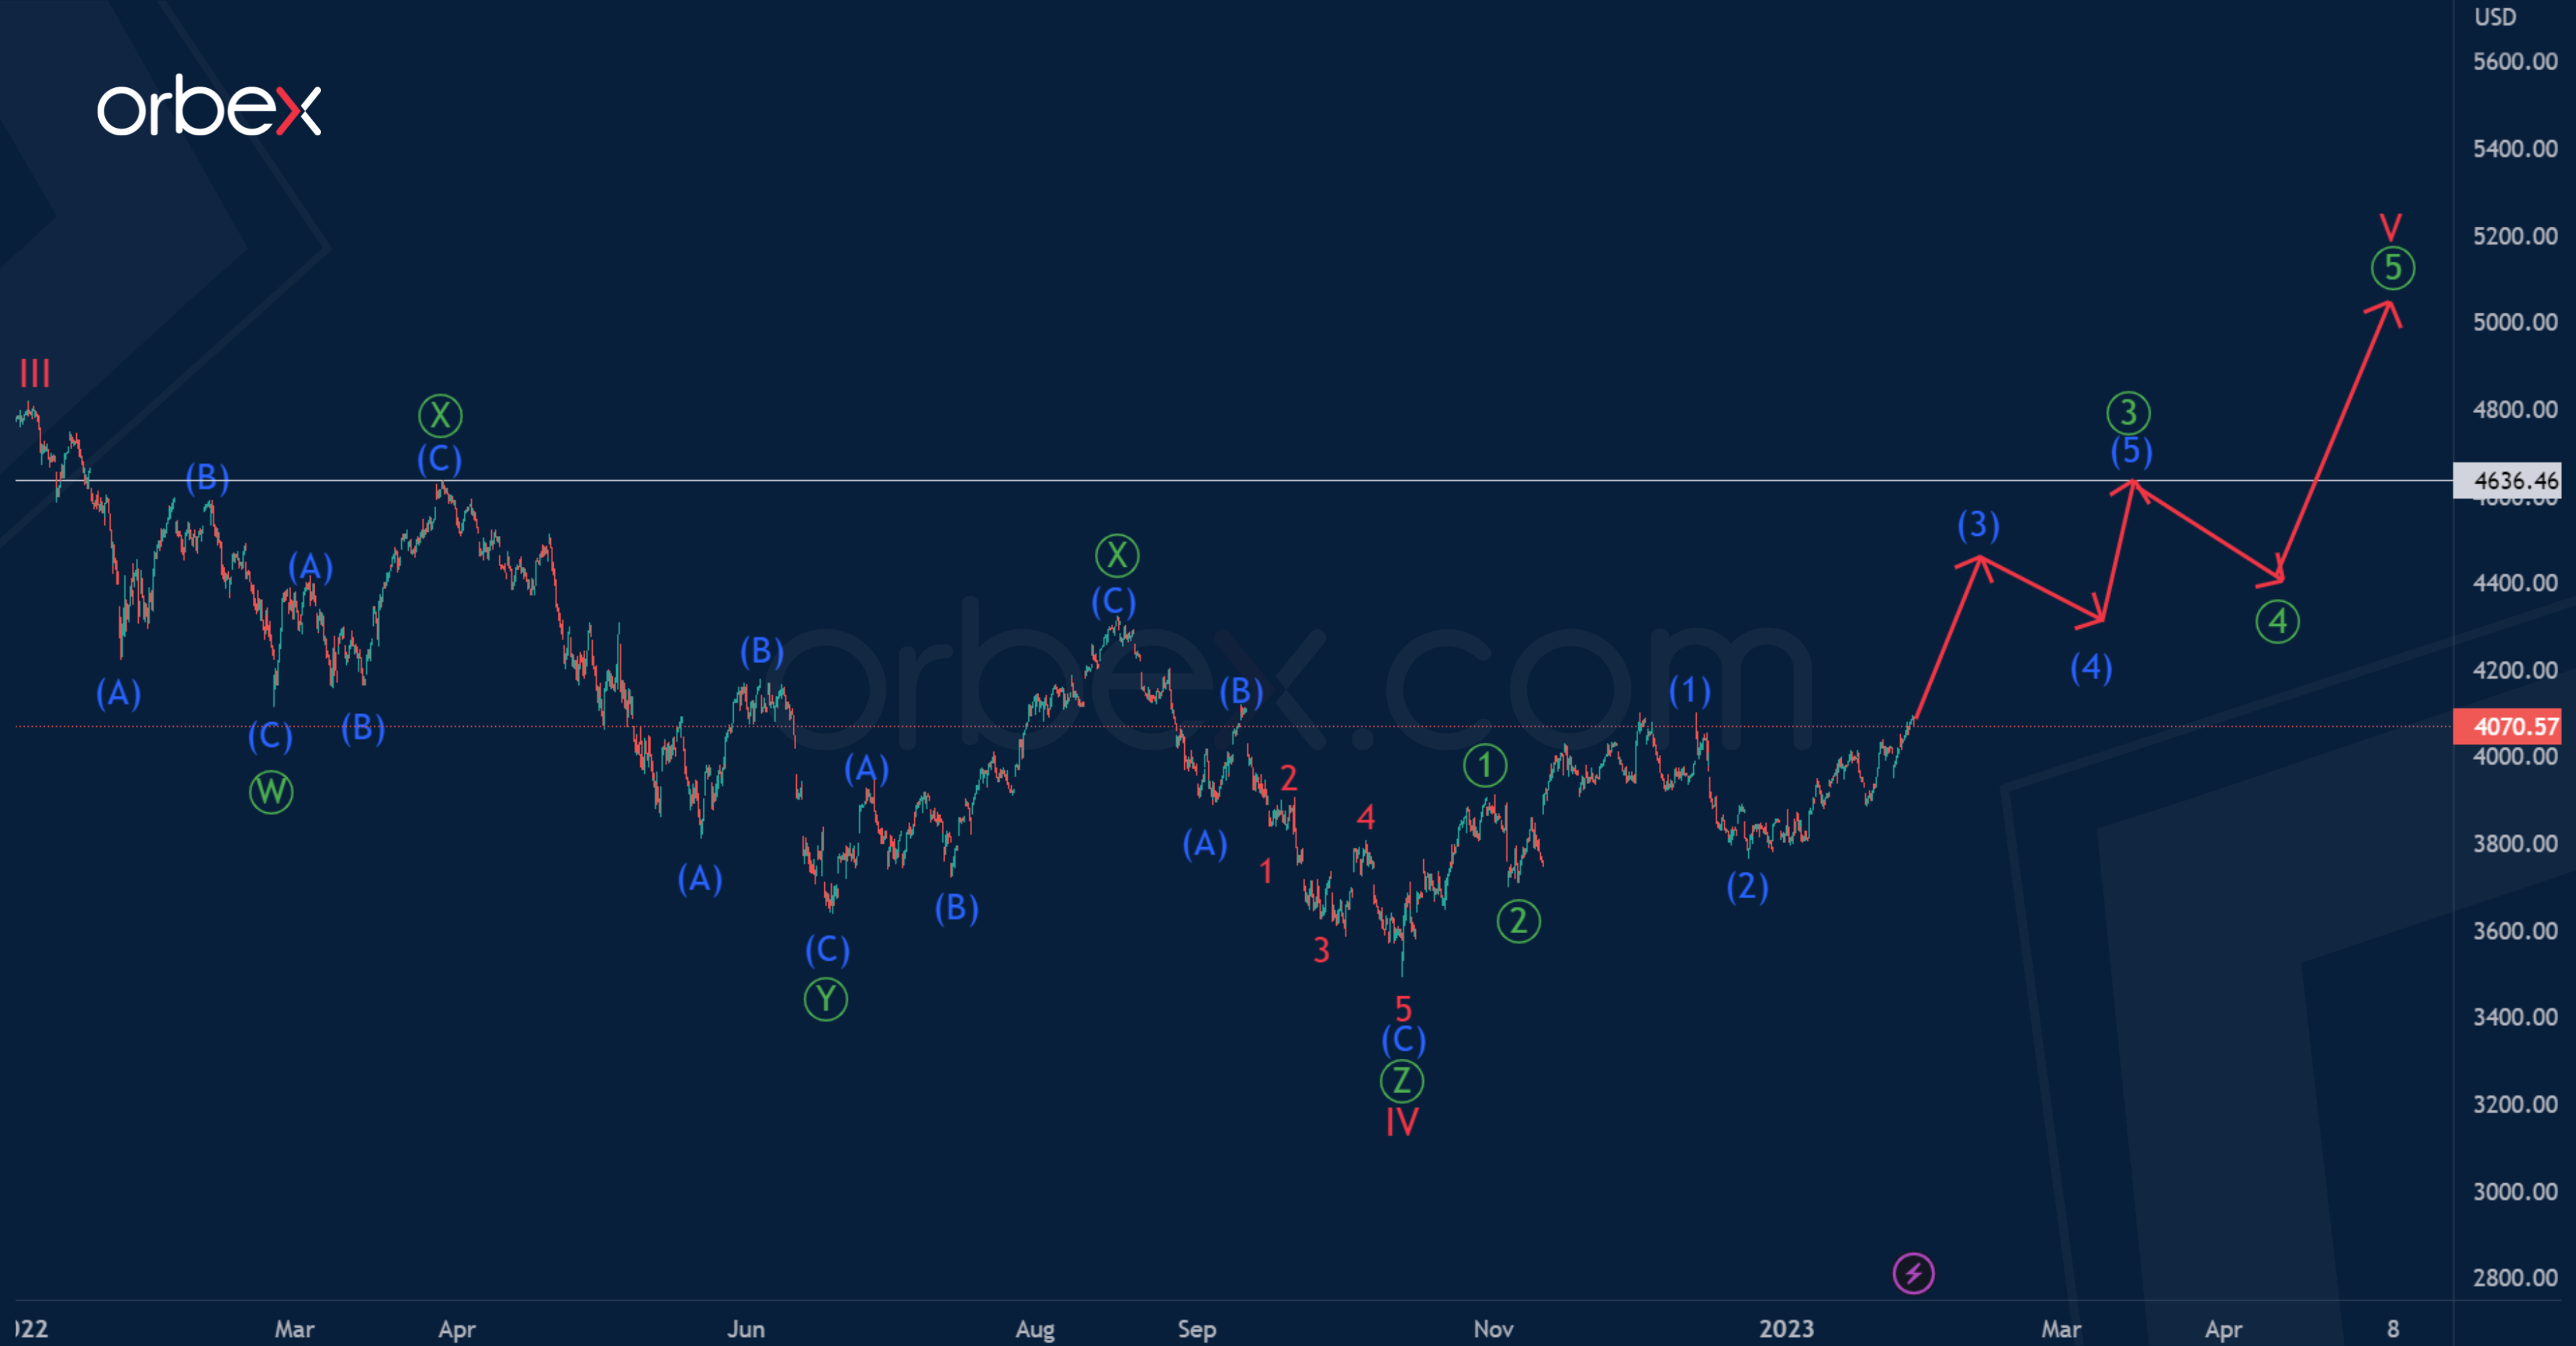
The current SPX500 timeframe shows the final part of a large impulse consisting of sub-waves I-II-III-IV-V.
We see a fully completed cycle correction IV as a primary triple zigzag.

In the near future, the price could continue to rise above 4636.46, within the final cycle wave V. This will take the form of a primary degree impulse.
At a maximum of 4636.46, we can expect the end of the primary impulse ③. An approximate scheme of possible future movement is shown on the chart.
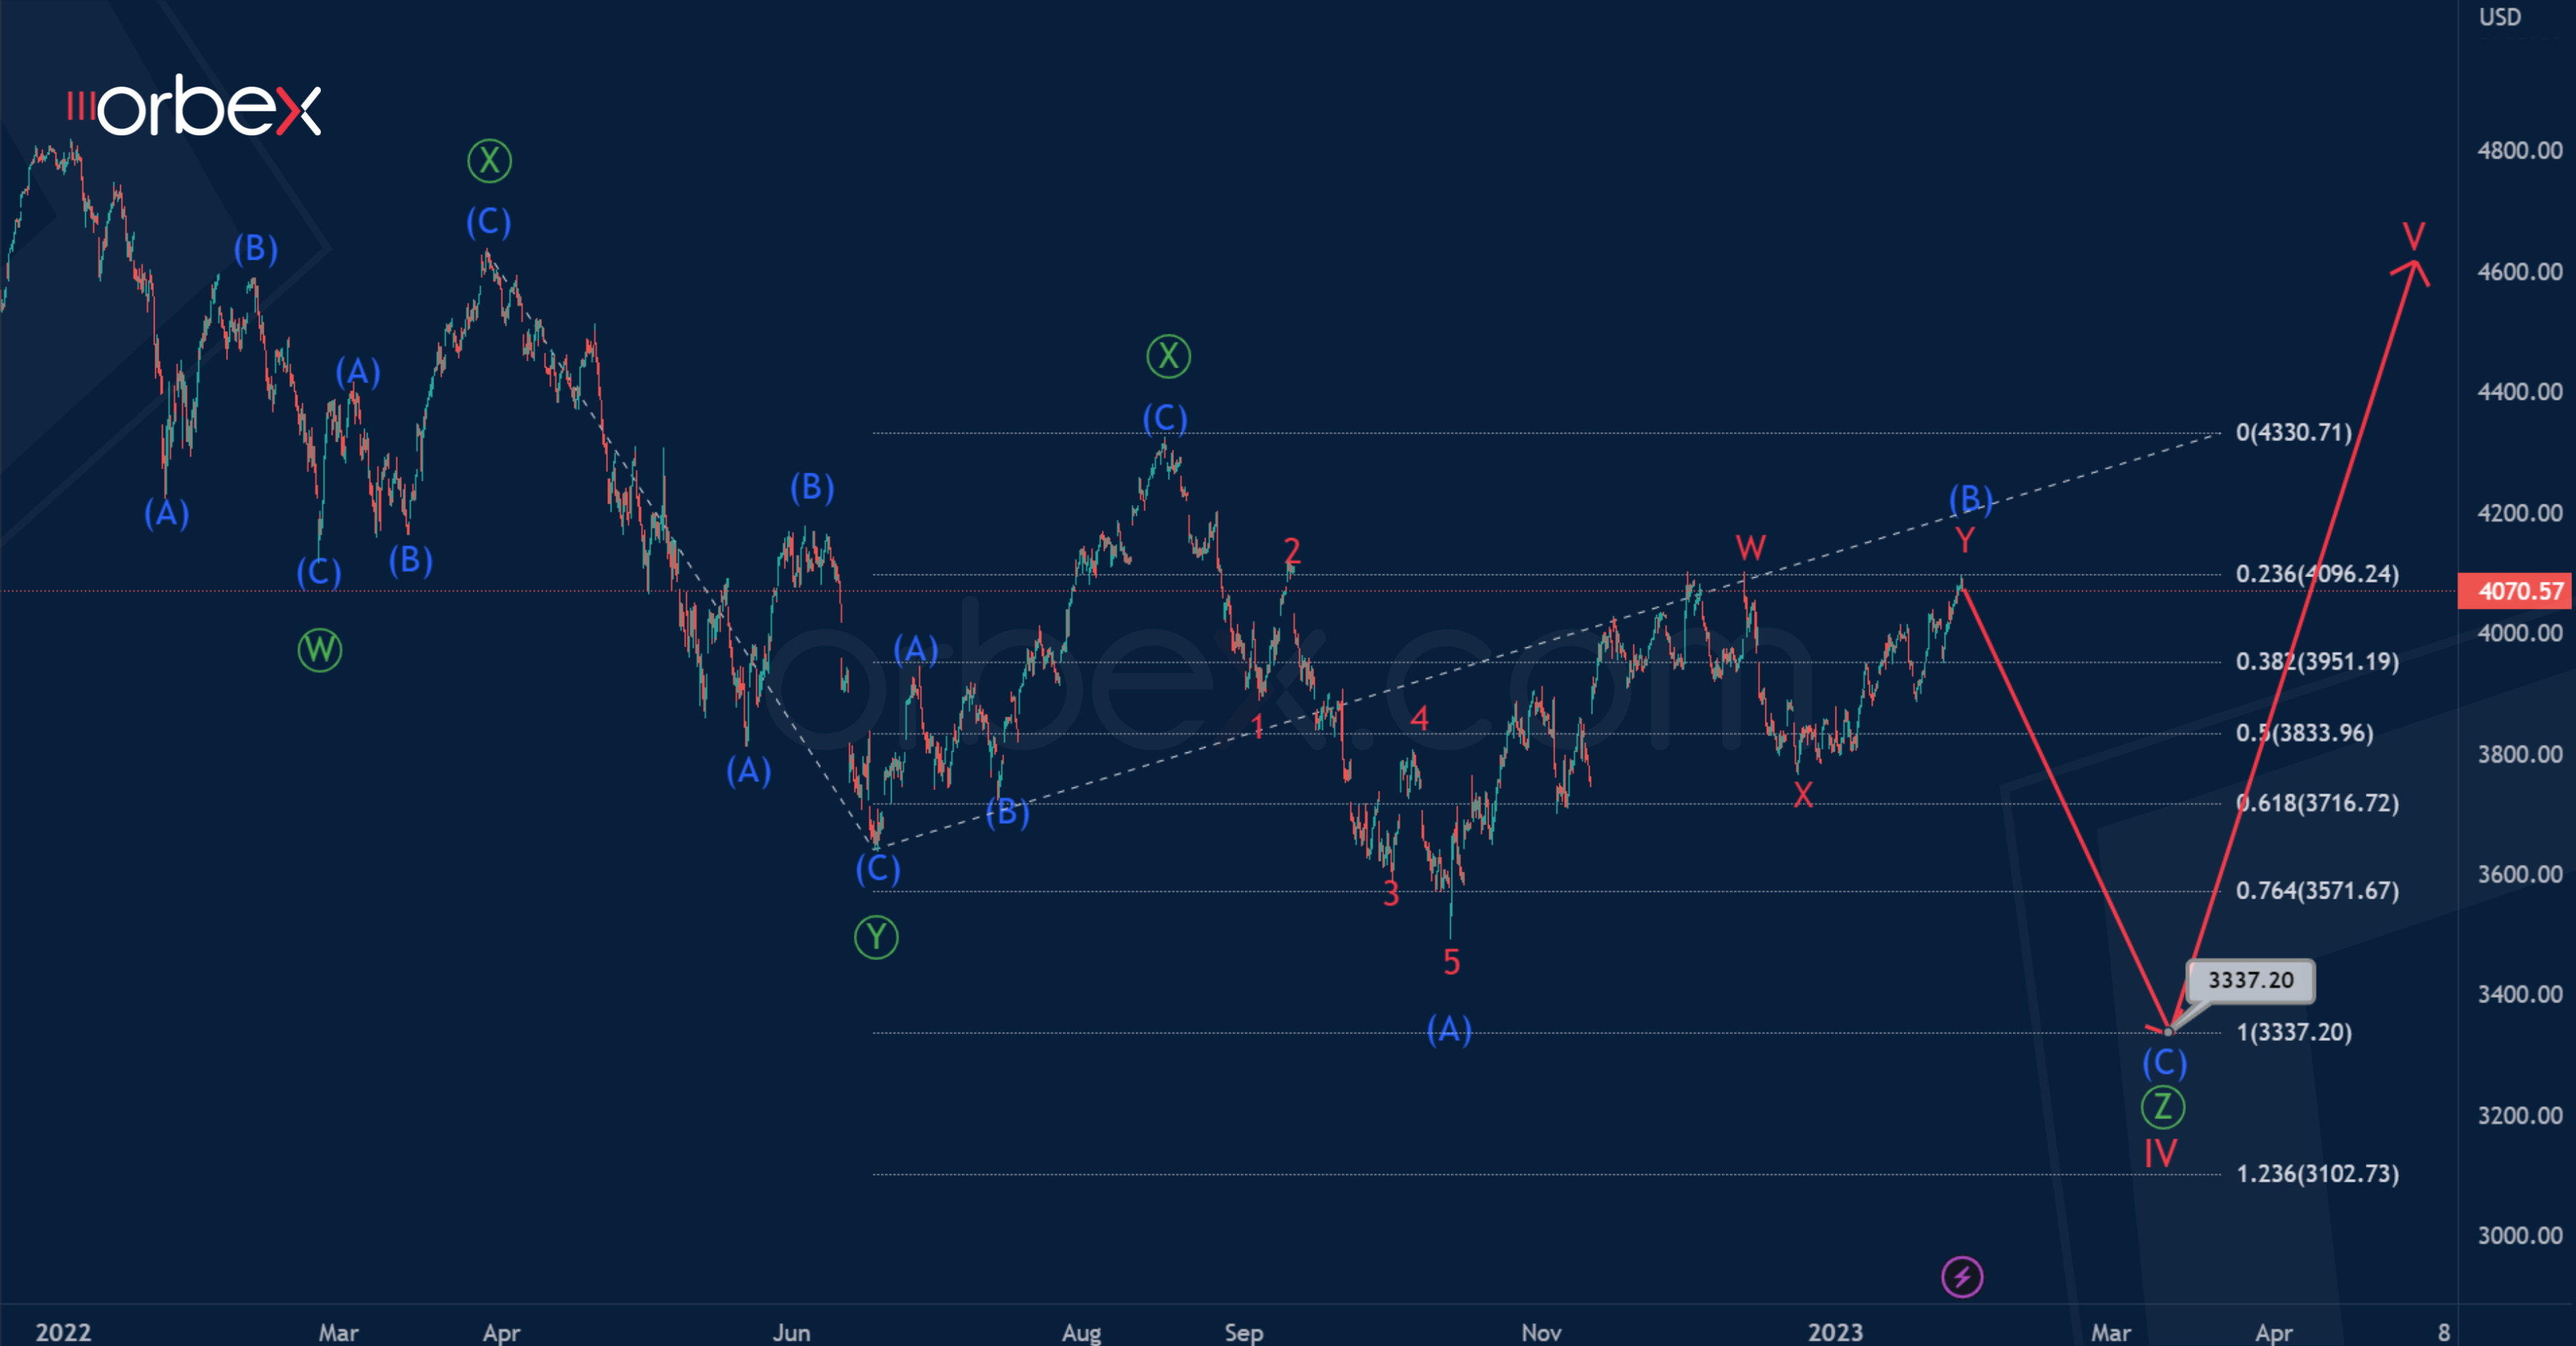
Let’s consider an alternative scenario in which the construction of correction IV continues. Its actionary wave Ⓩ seems to be striving for equality with the wave Ⓨ.
In the near future, SPX500 is likely to fall to 3337.20. At that level, sub-waves Ⓩ and Ⓨ will be equal.
After reaching the specified level, the price could turn around and start an upward movement. For the formation of the wave Ⓩ, the successful completion of the impulse wave (C) of the intermediate degree is necessary.

