
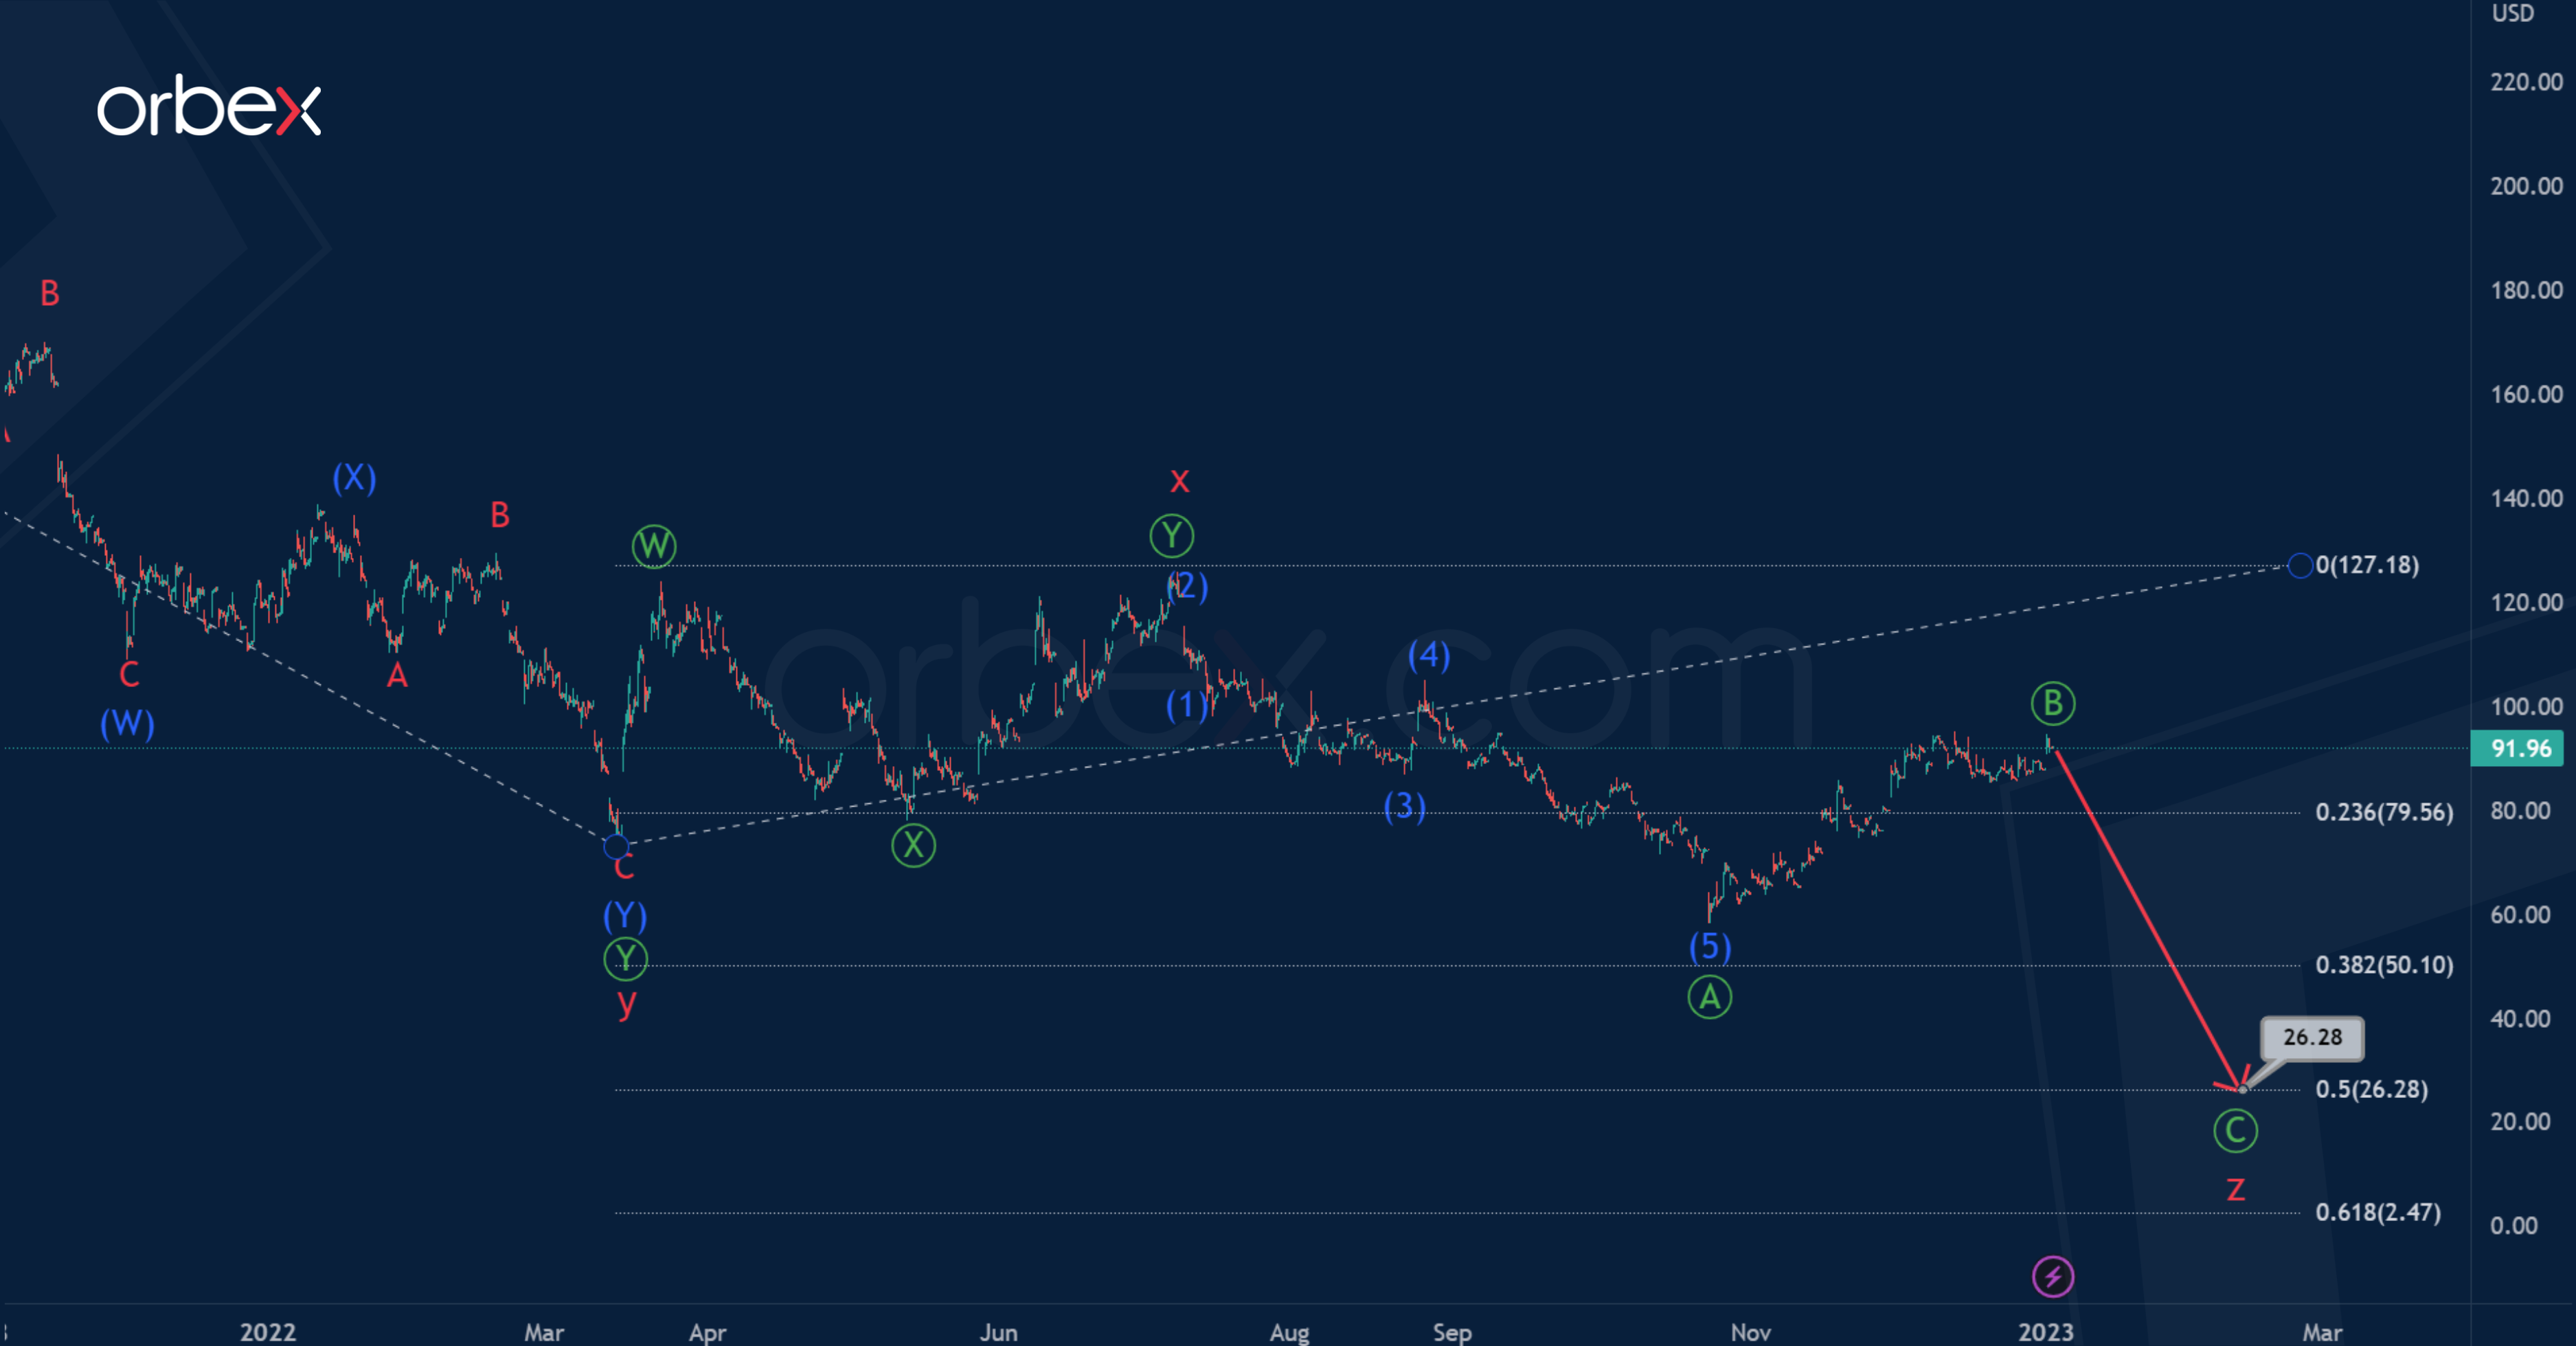
The internal structure of BABA shares suggests the construction of a bearish trend taking the form of a cycle triple zigzag w-x-y-x-z.
We see the completed actionary wave y and the second small intervening wave x, which are double zigzags.

Now the formation of the final actionary wave z is taking place. This will take the form of a primary zigzag Ⓐ-Ⓑ-Ⓒ.
There is a high probability that the impulse Ⓐ and correction Ⓑ have already ended. So we can expect a decline to 26.28 in the sub-wave Ⓒ. At the specified mark, wave z will be at 50% of wave y.
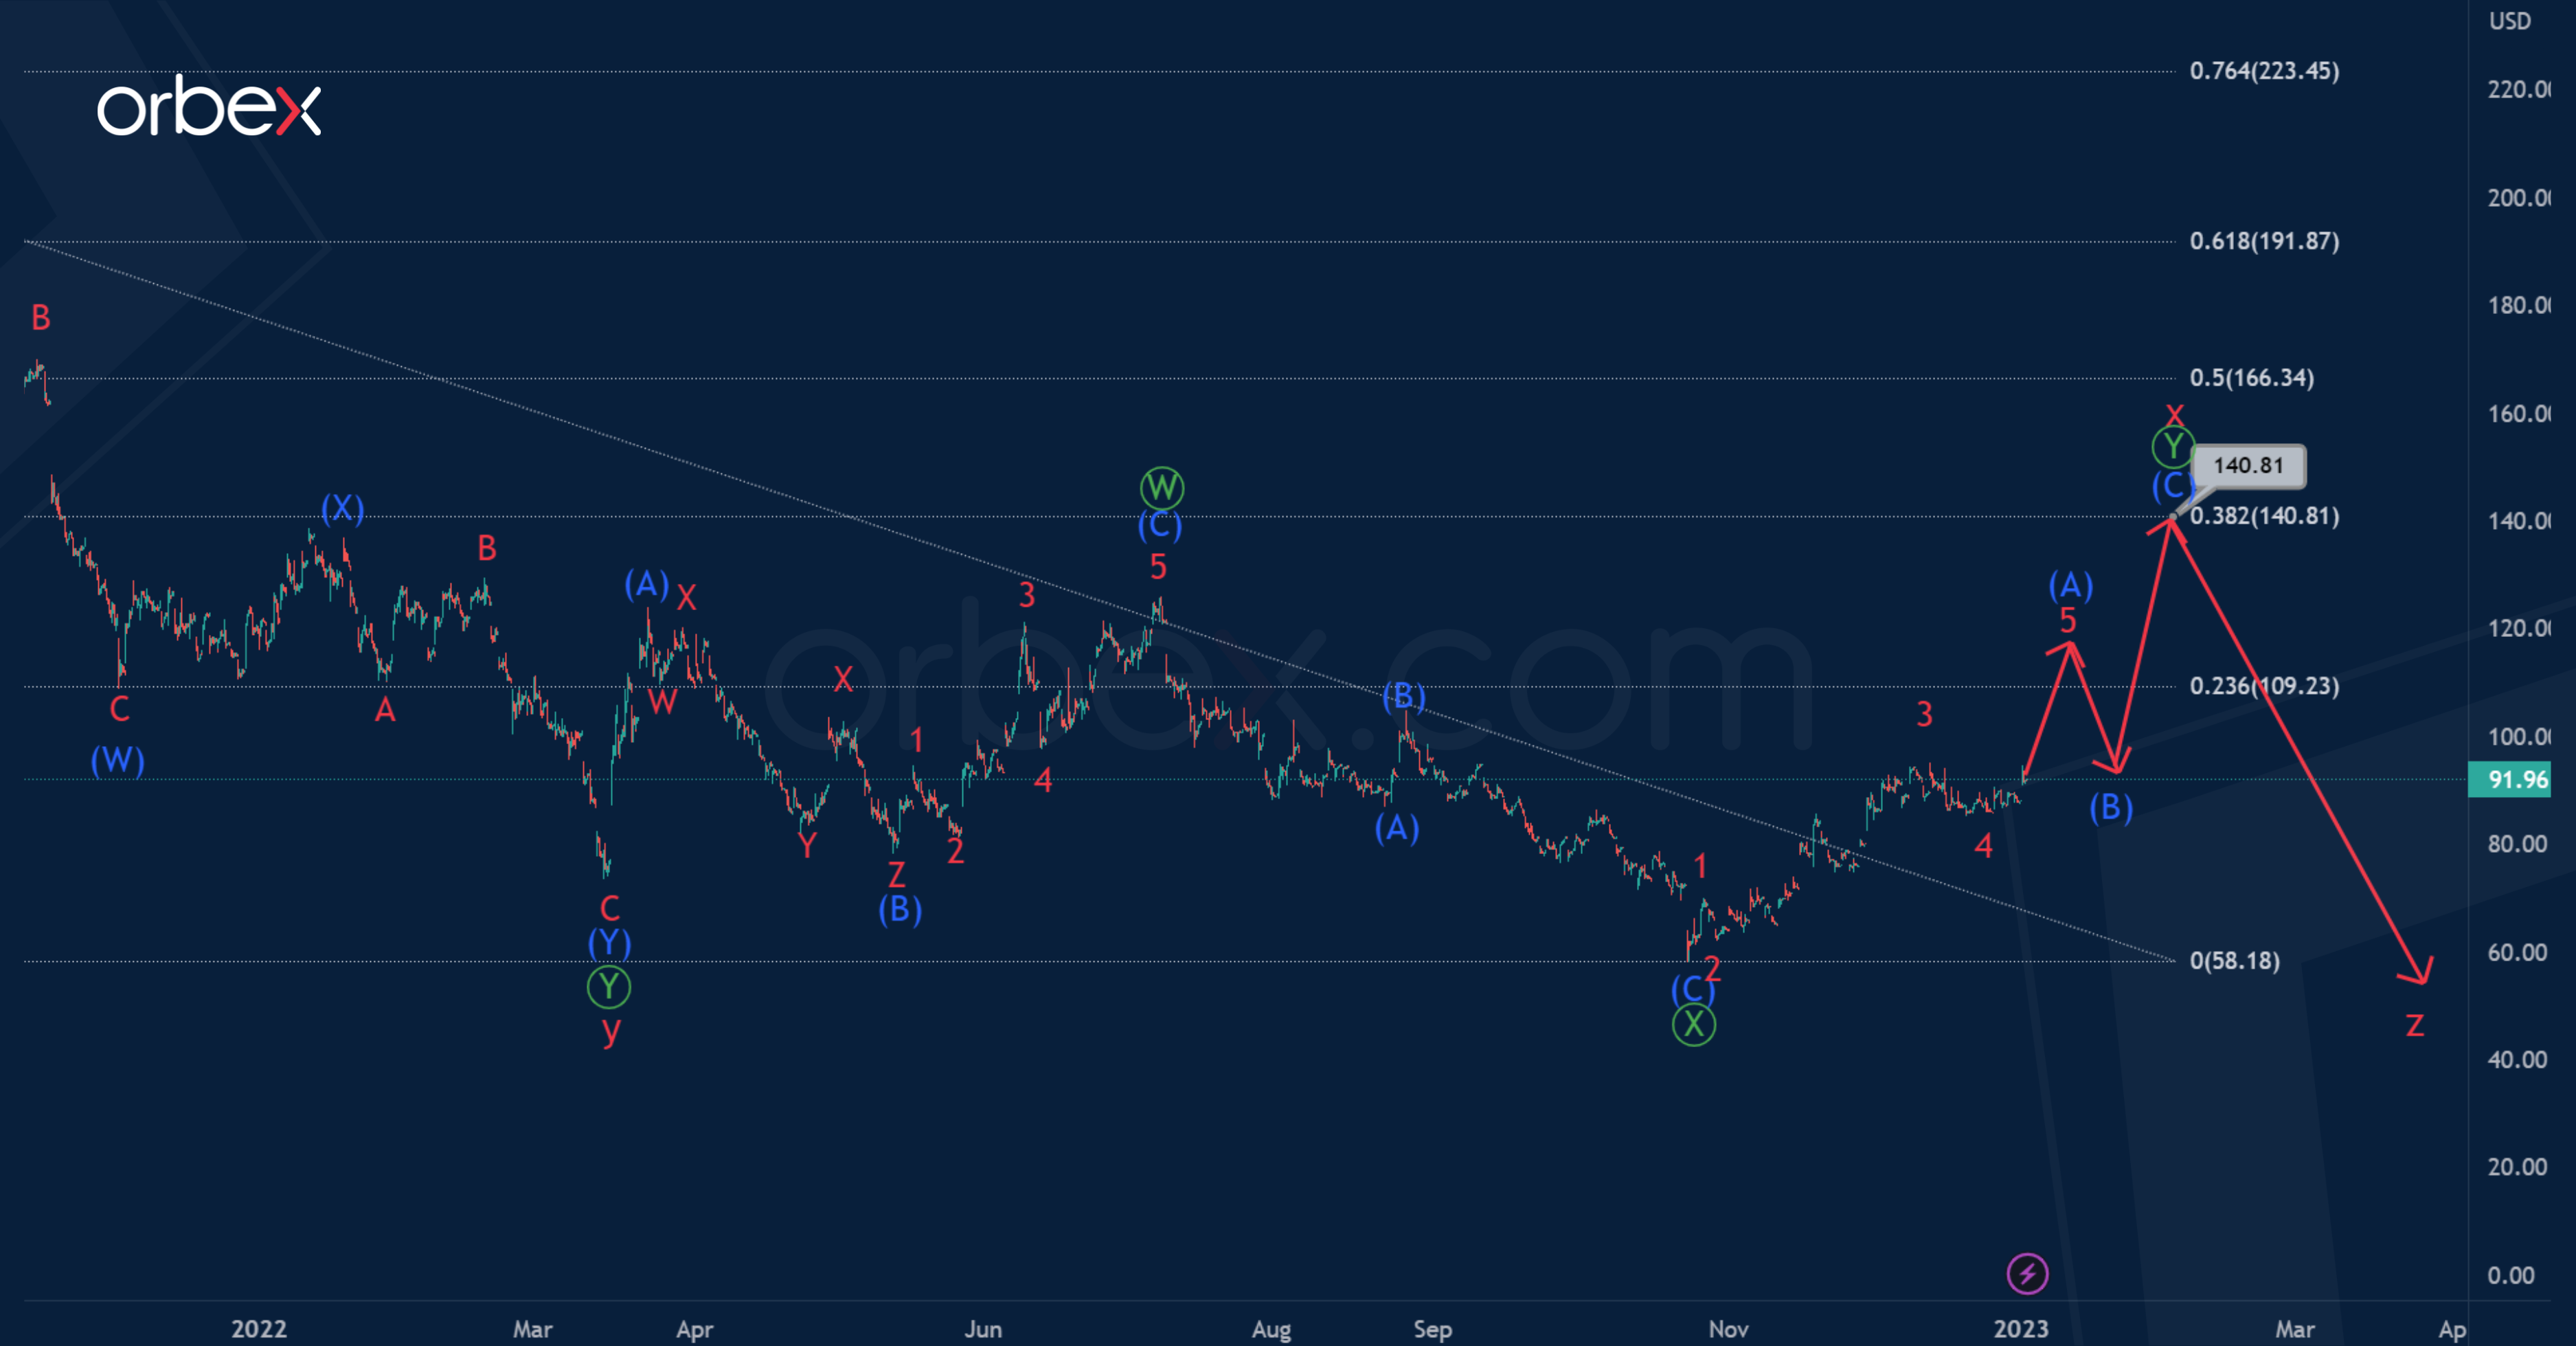
The second chart hints at an incomplete intervening wave x. Here it will take the form of a double zigzag of the primary degree Ⓦ-Ⓧ-Ⓨ. The first two zigzag sub-waves Ⓦ-Ⓧ look finished.
Now the price is in the wave Ⓨ. It is assumed that this wave will take a standard zigzag structure of the intermediate degree (A)-(B)-(C), as shown in the chart.
The growth of the shares should be expected to 140.81. At that level, cycle intervening wave x will be at 38.2% of actionary wave y.

