
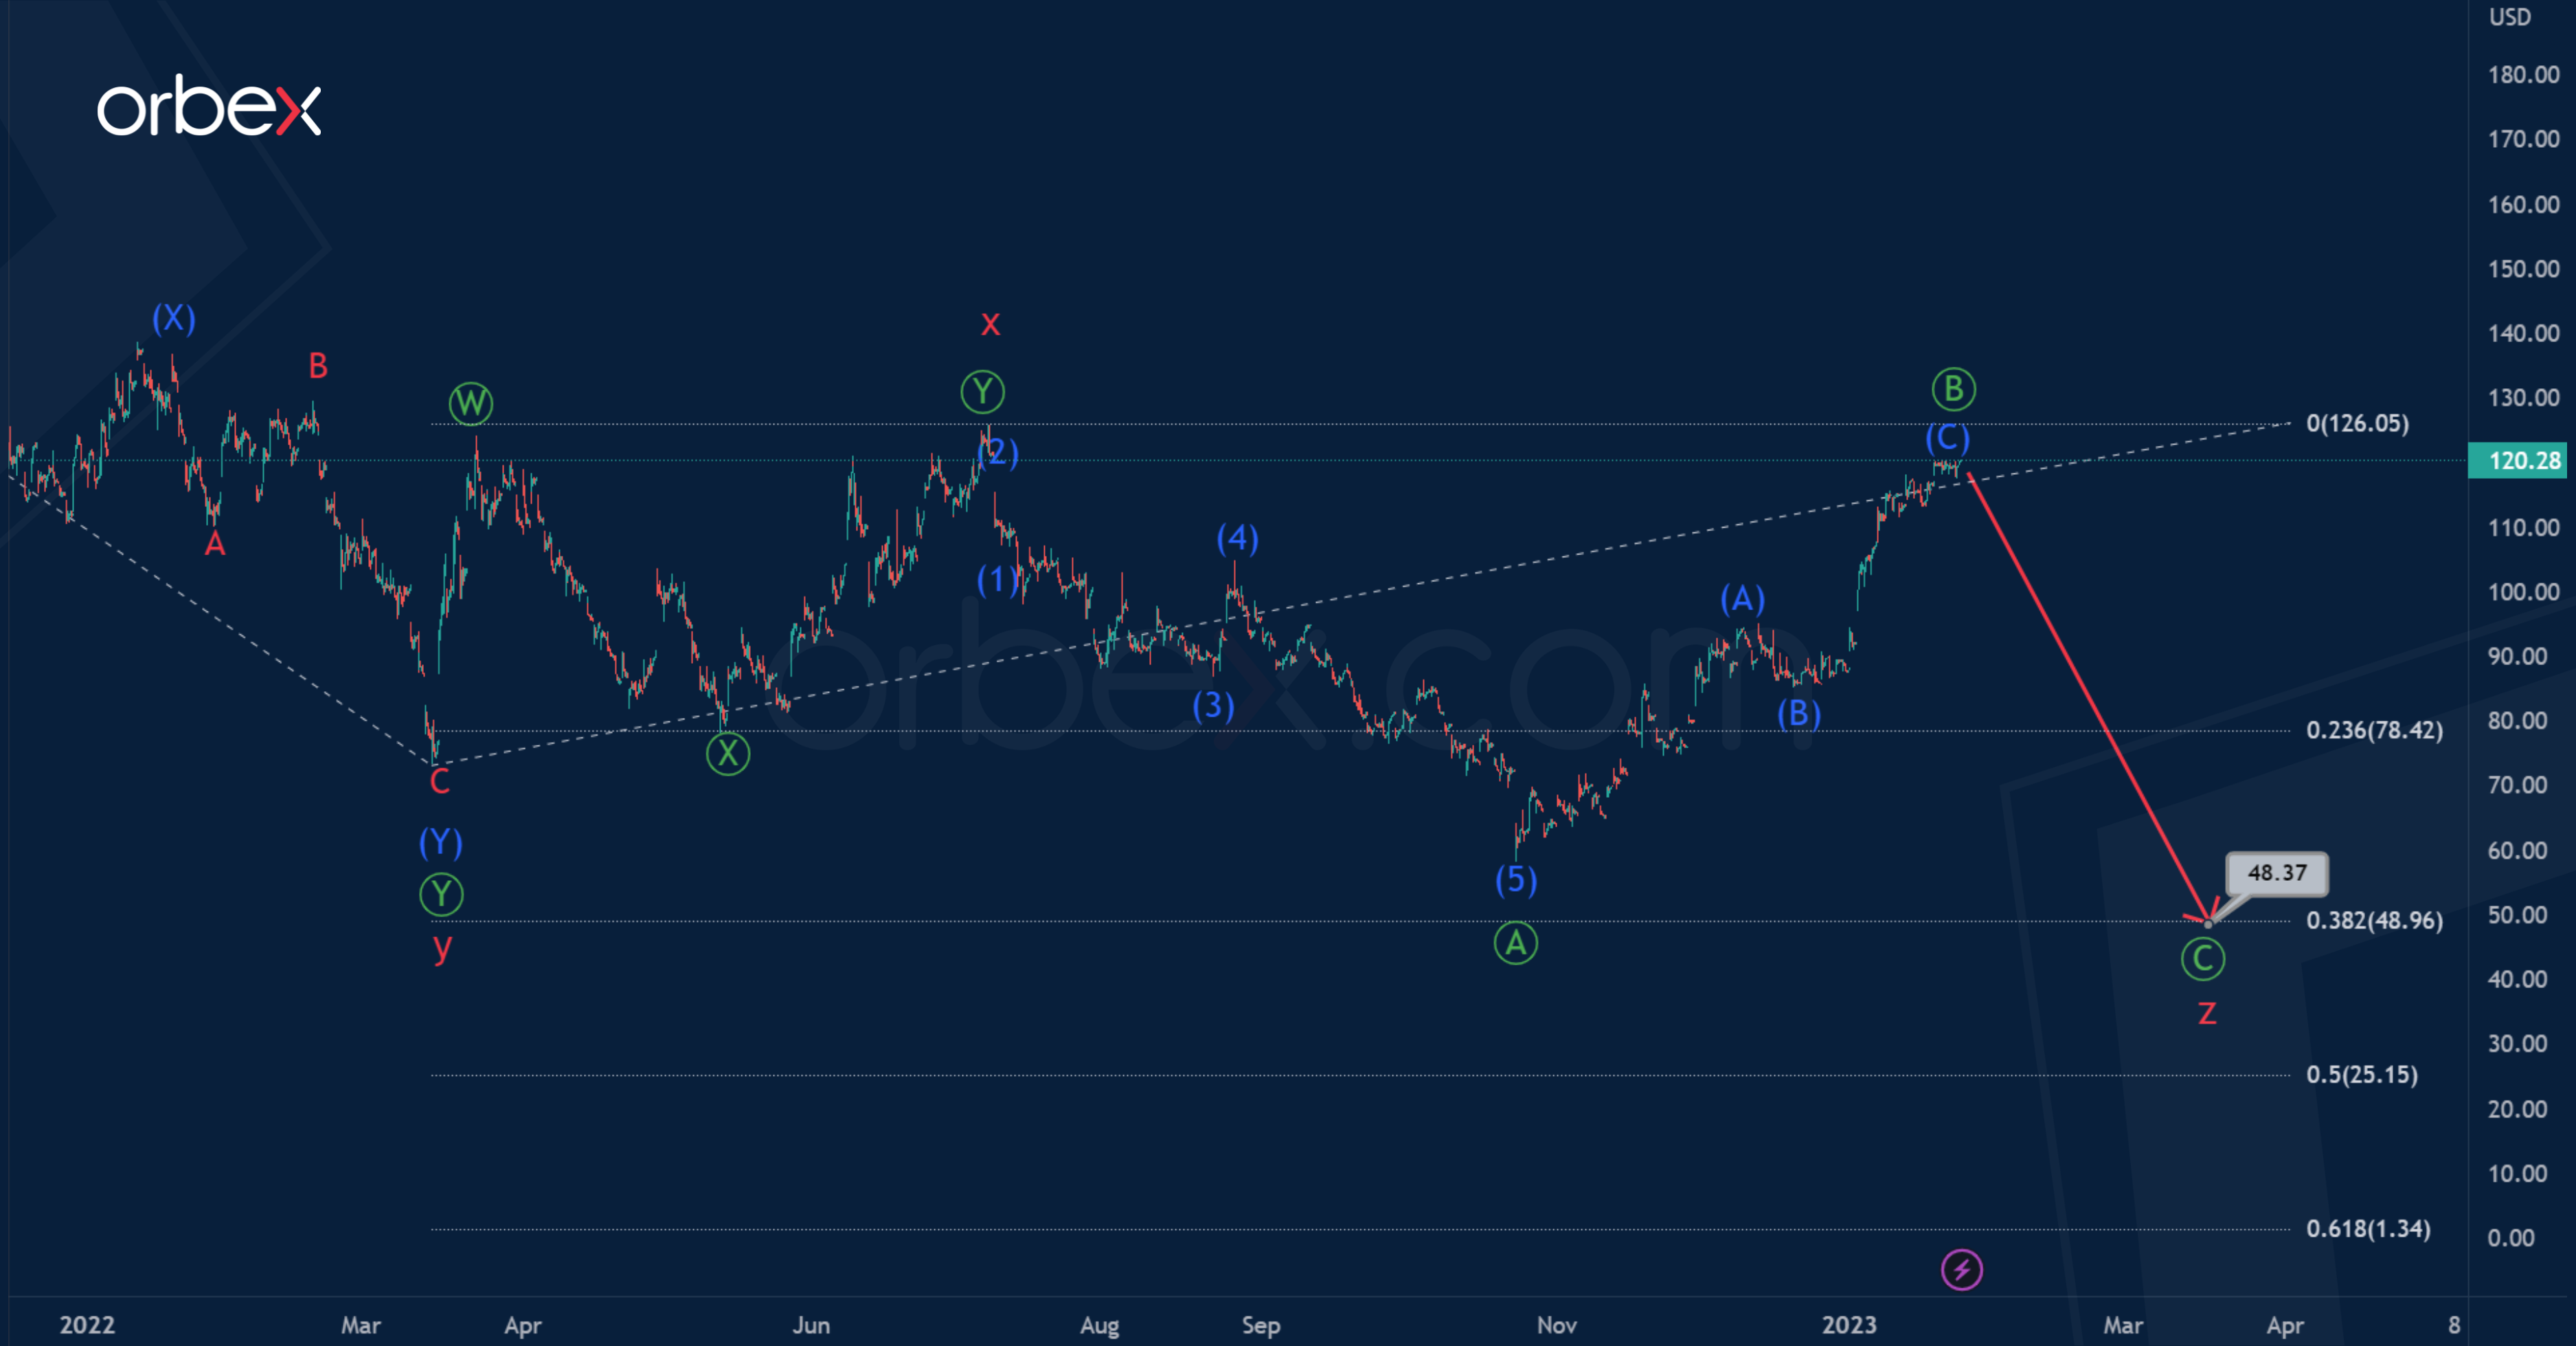
BABA suggests the continuation of the bearish trend. This takes the form of a cycle triple zigzag consisting of sub-waves w-x-y-x-z.
The actionary wave y and the intervening wave x have ended as double zigzags.

Wave z is now under development. It is likely to take the form of a primary zigzag Ⓐ-Ⓑ-Ⓒ.
There is a high probability that the impulse Ⓐ and correction Ⓑ have already ended. In the near future, we can expect a decline to 48.37 in the sub-wave Ⓒ. At the specified mark, wave z will be at 38.2% of wave y.
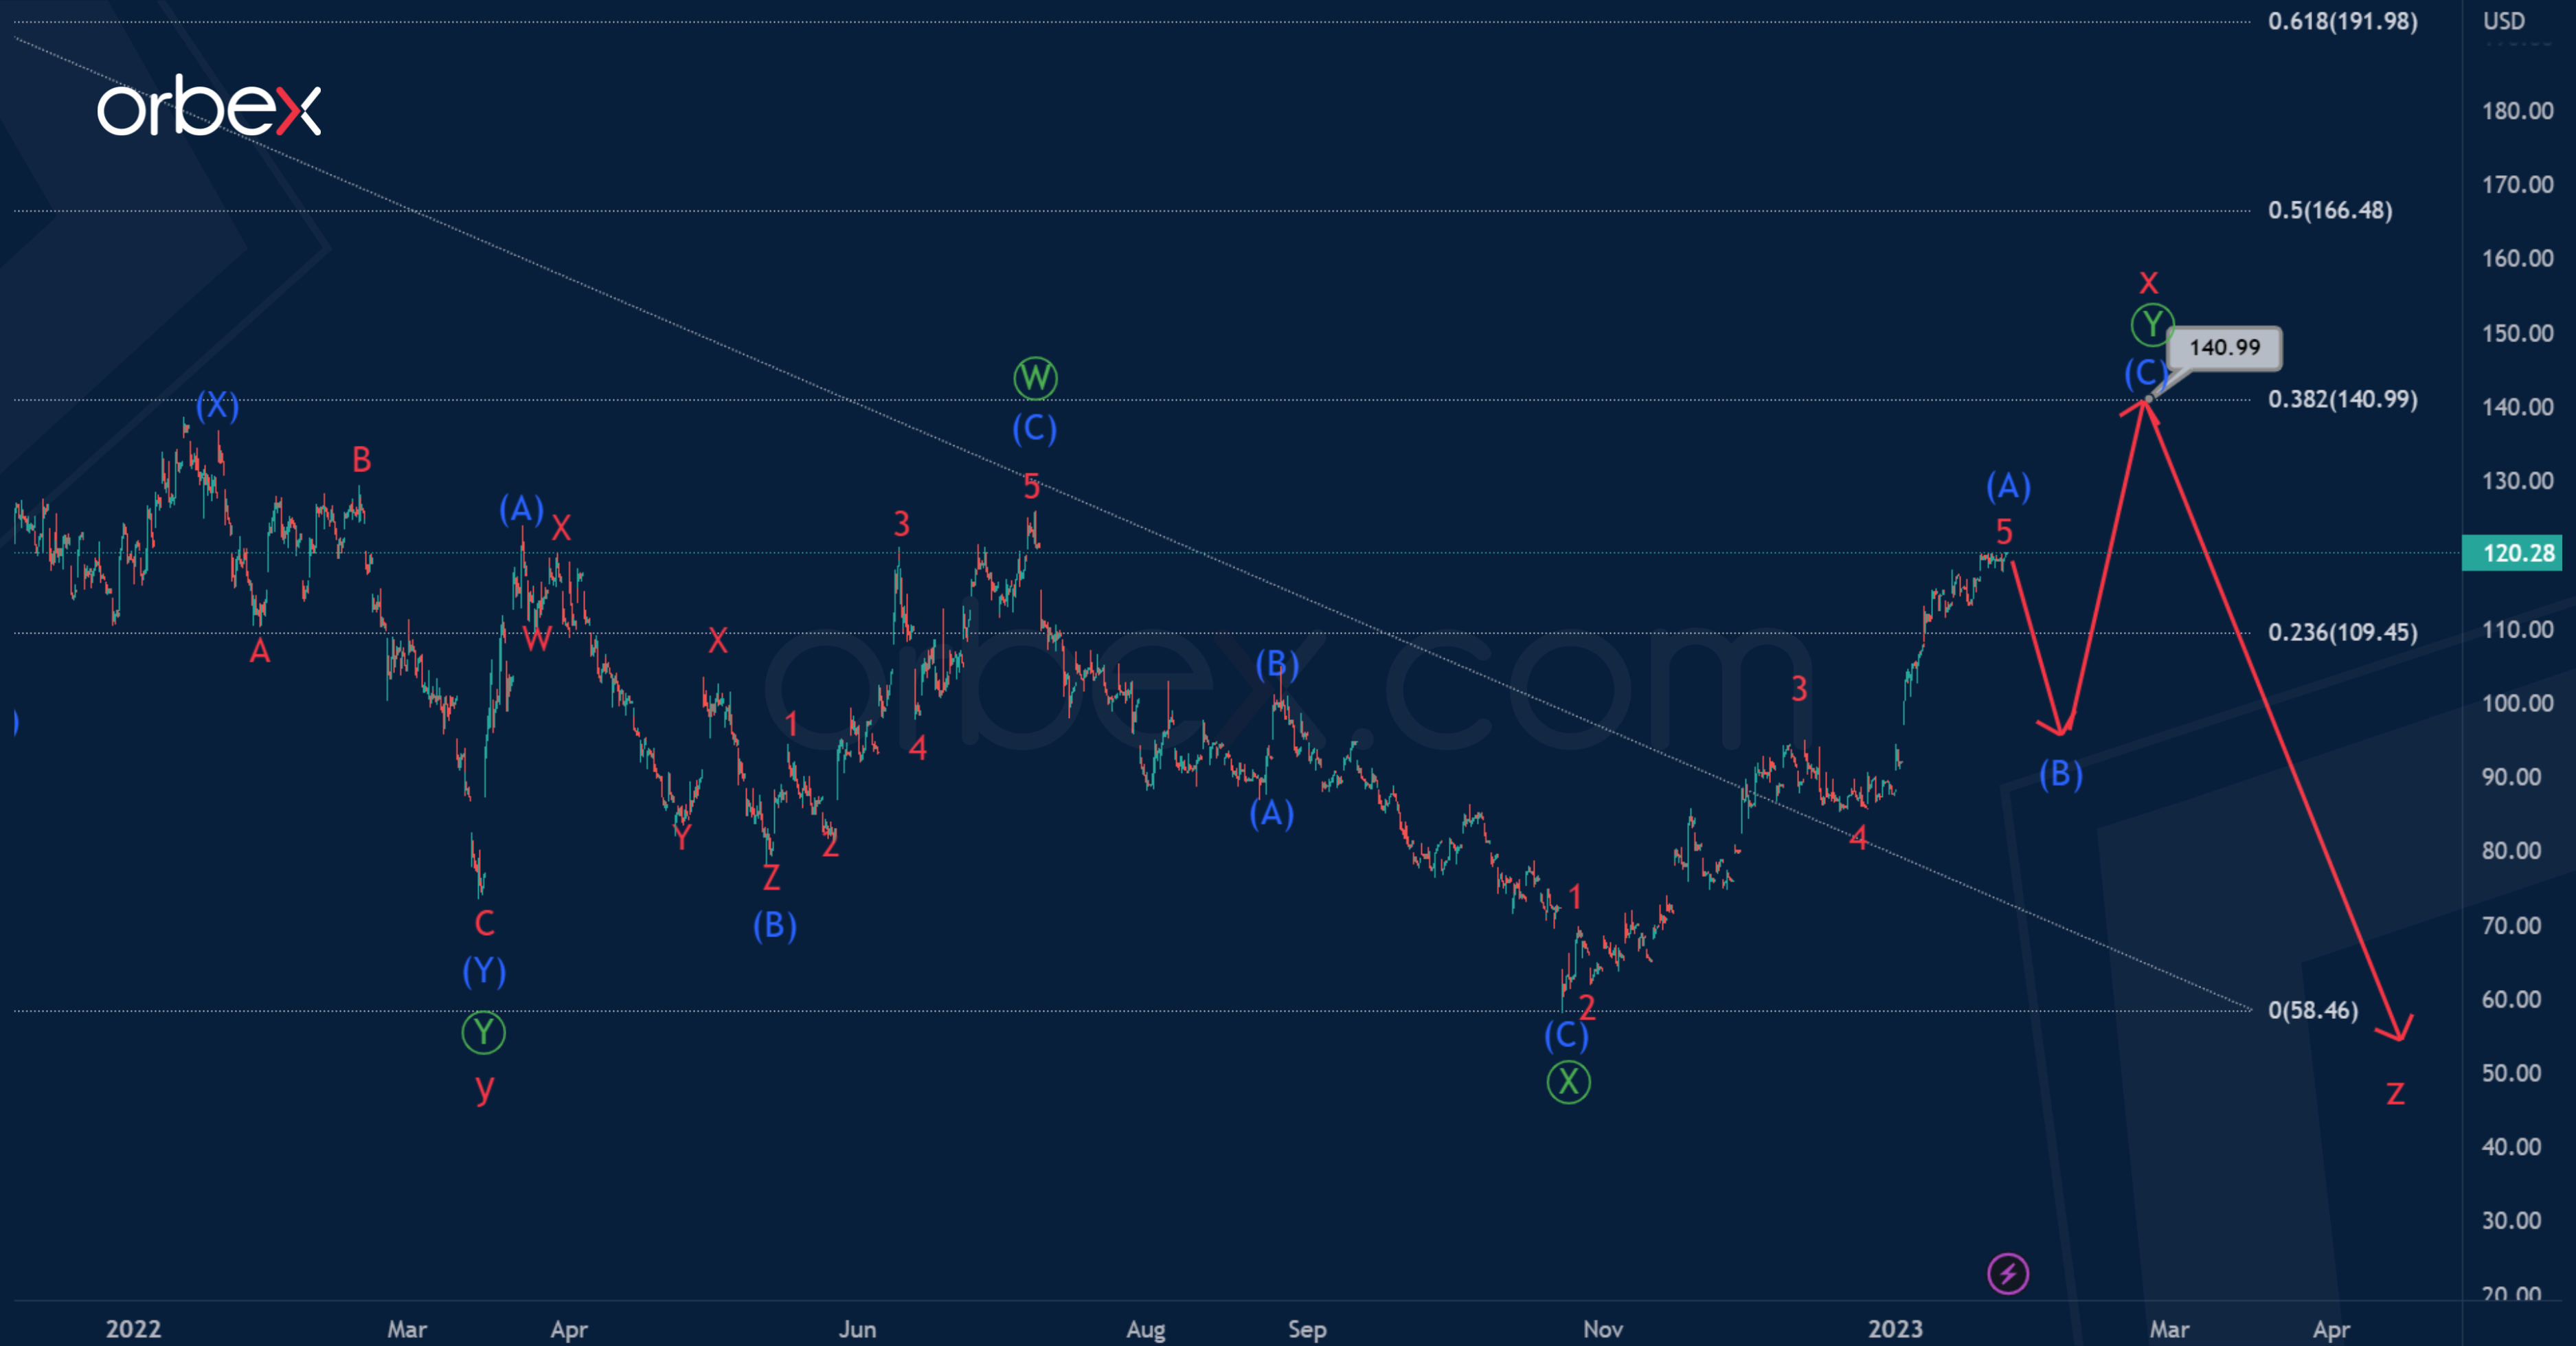
Alternatively, the construction of the intervening wave x continues. Perhaps it will take the form of a primary double zigzag Ⓦ-Ⓧ-Ⓨ. The first two zigzag which are sub-waves Ⓦ-Ⓧ look completed.
Wave Ⓨ is under development. It could take a zigzag structure of the intermediate degree (A)-(B)-(C), as shown in the chart.
The stock price could rise to 140.99. At that level, cycle intervening wave x will be at 38.2% of actionary wave y.

![Credit Card 160×600 [EN]](https://assets.iorbex.com/blog/wp-content/uploads/2023/06/13144507/Blog-Banner_EN-Banner_160X600X2.webp)