
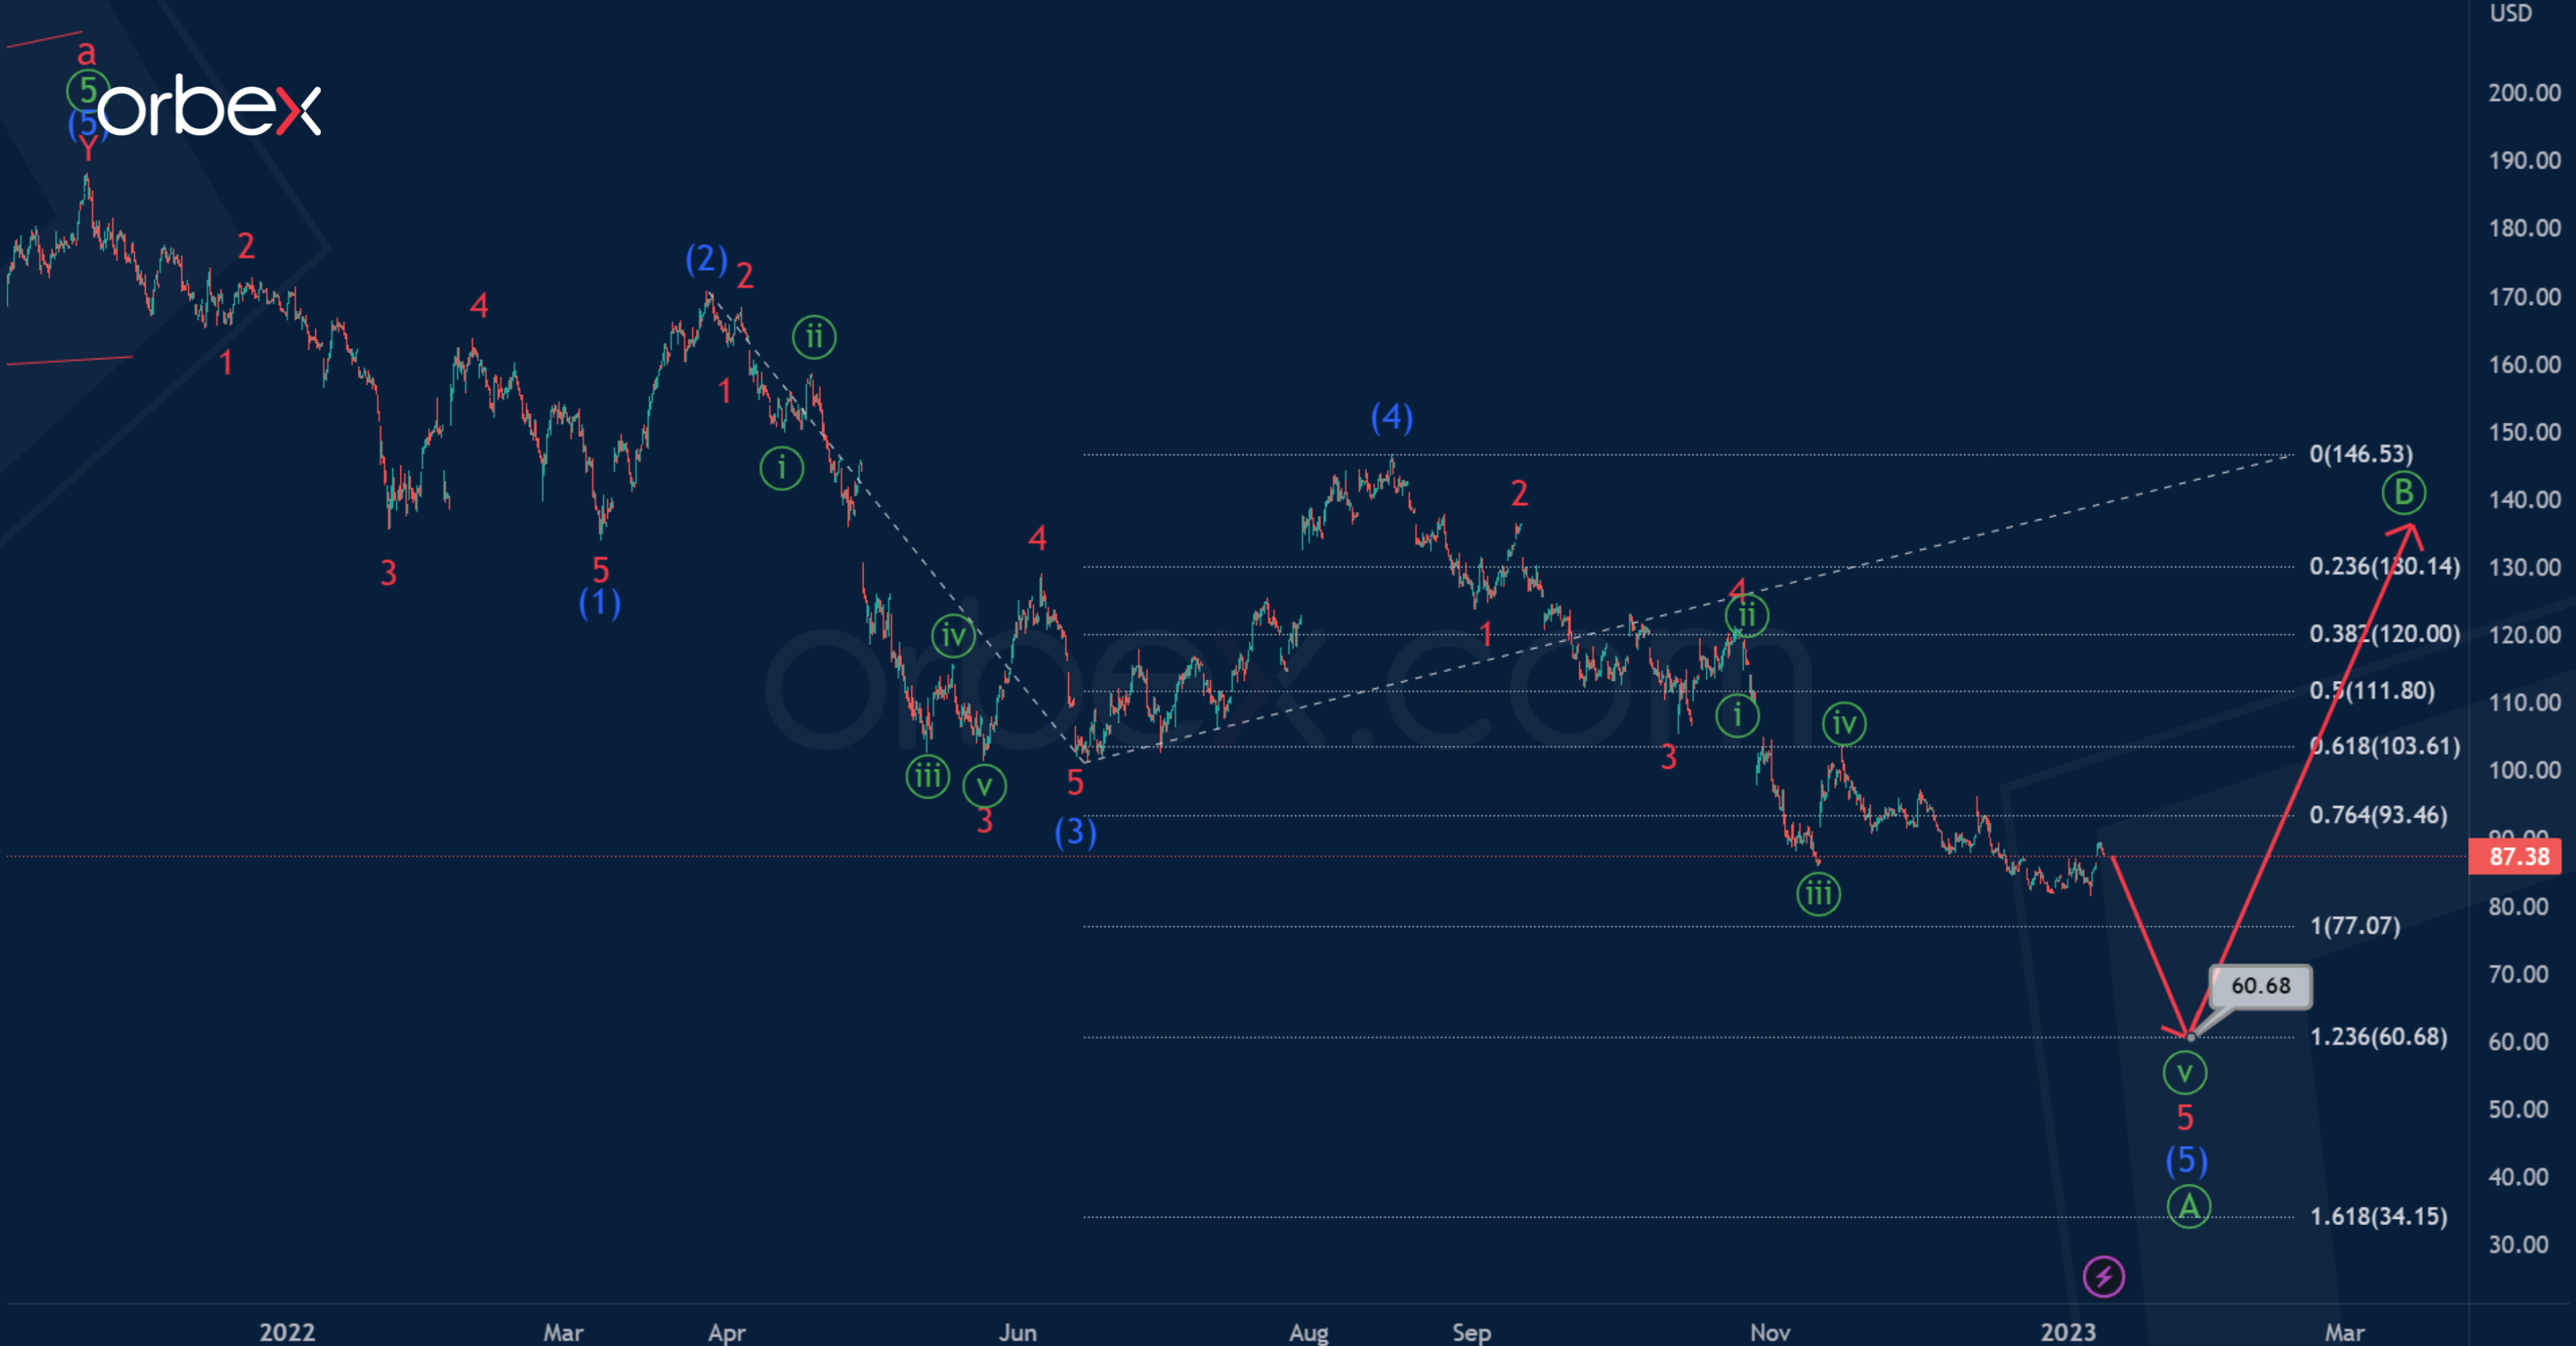
The current AMZN structure suggests a corrective trend. It is assumed that a zigzag is formed, which consists of cycle sub-waves a-b-c.
After the end of the impulse growth of wave a, prices declined. This could indicate the beginning of a bearish correction b. It could take the form of a primary zigzag Ⓐ-Ⓑ-Ⓒ.

In the near future, we can expect prices to continue to fall in the final intermediate wave (5) of the leading diagonal Ⓐ to 60.68. At that level, wave (5) will be at 123.6% of previous impulse (3).
After the end of the wave Ⓐ, the primary correction Ⓑ should move higher.
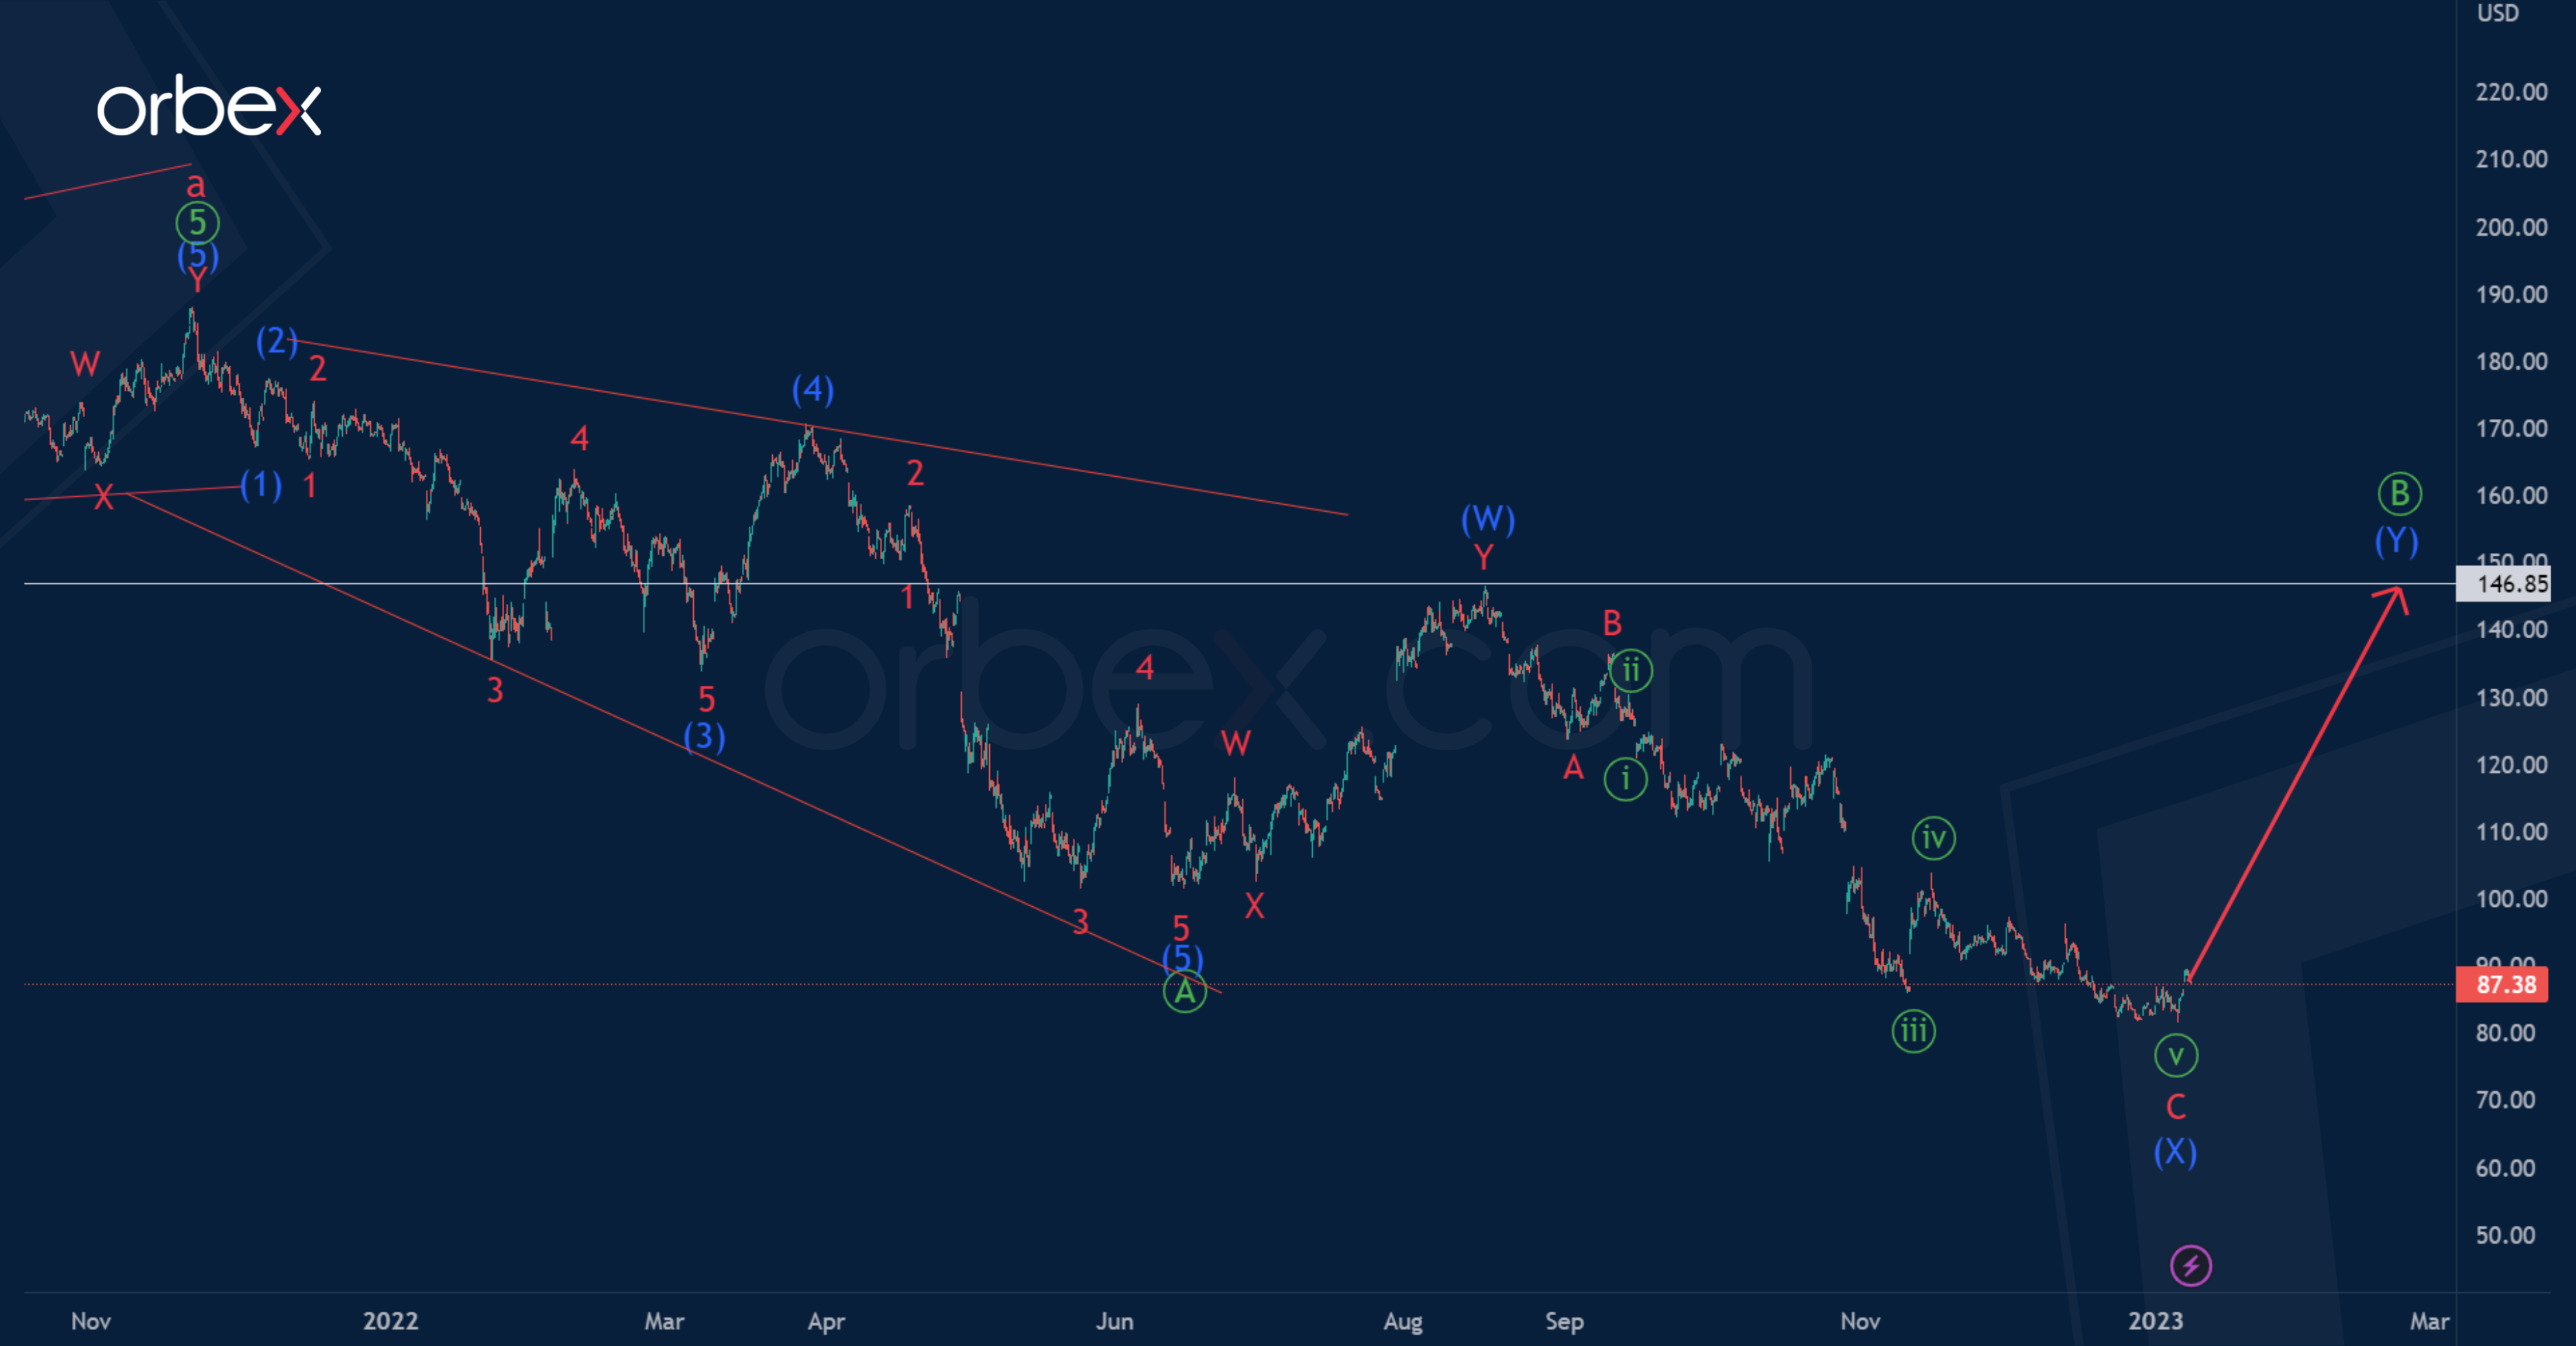
Alternatively, the leading diagonal Ⓐ is fully completed.
In this case, in the last section of the chart, we see a price increase in a sideways correction.
It is assumed that the correction wave Ⓑ will take the form of an intermediate double three (W)-(X)-(Y).
The second intervening wave (X) has ended. Therefore, an upward movement in the final wave (Y) to a maximum of 146.85 is expected in the near future.

