
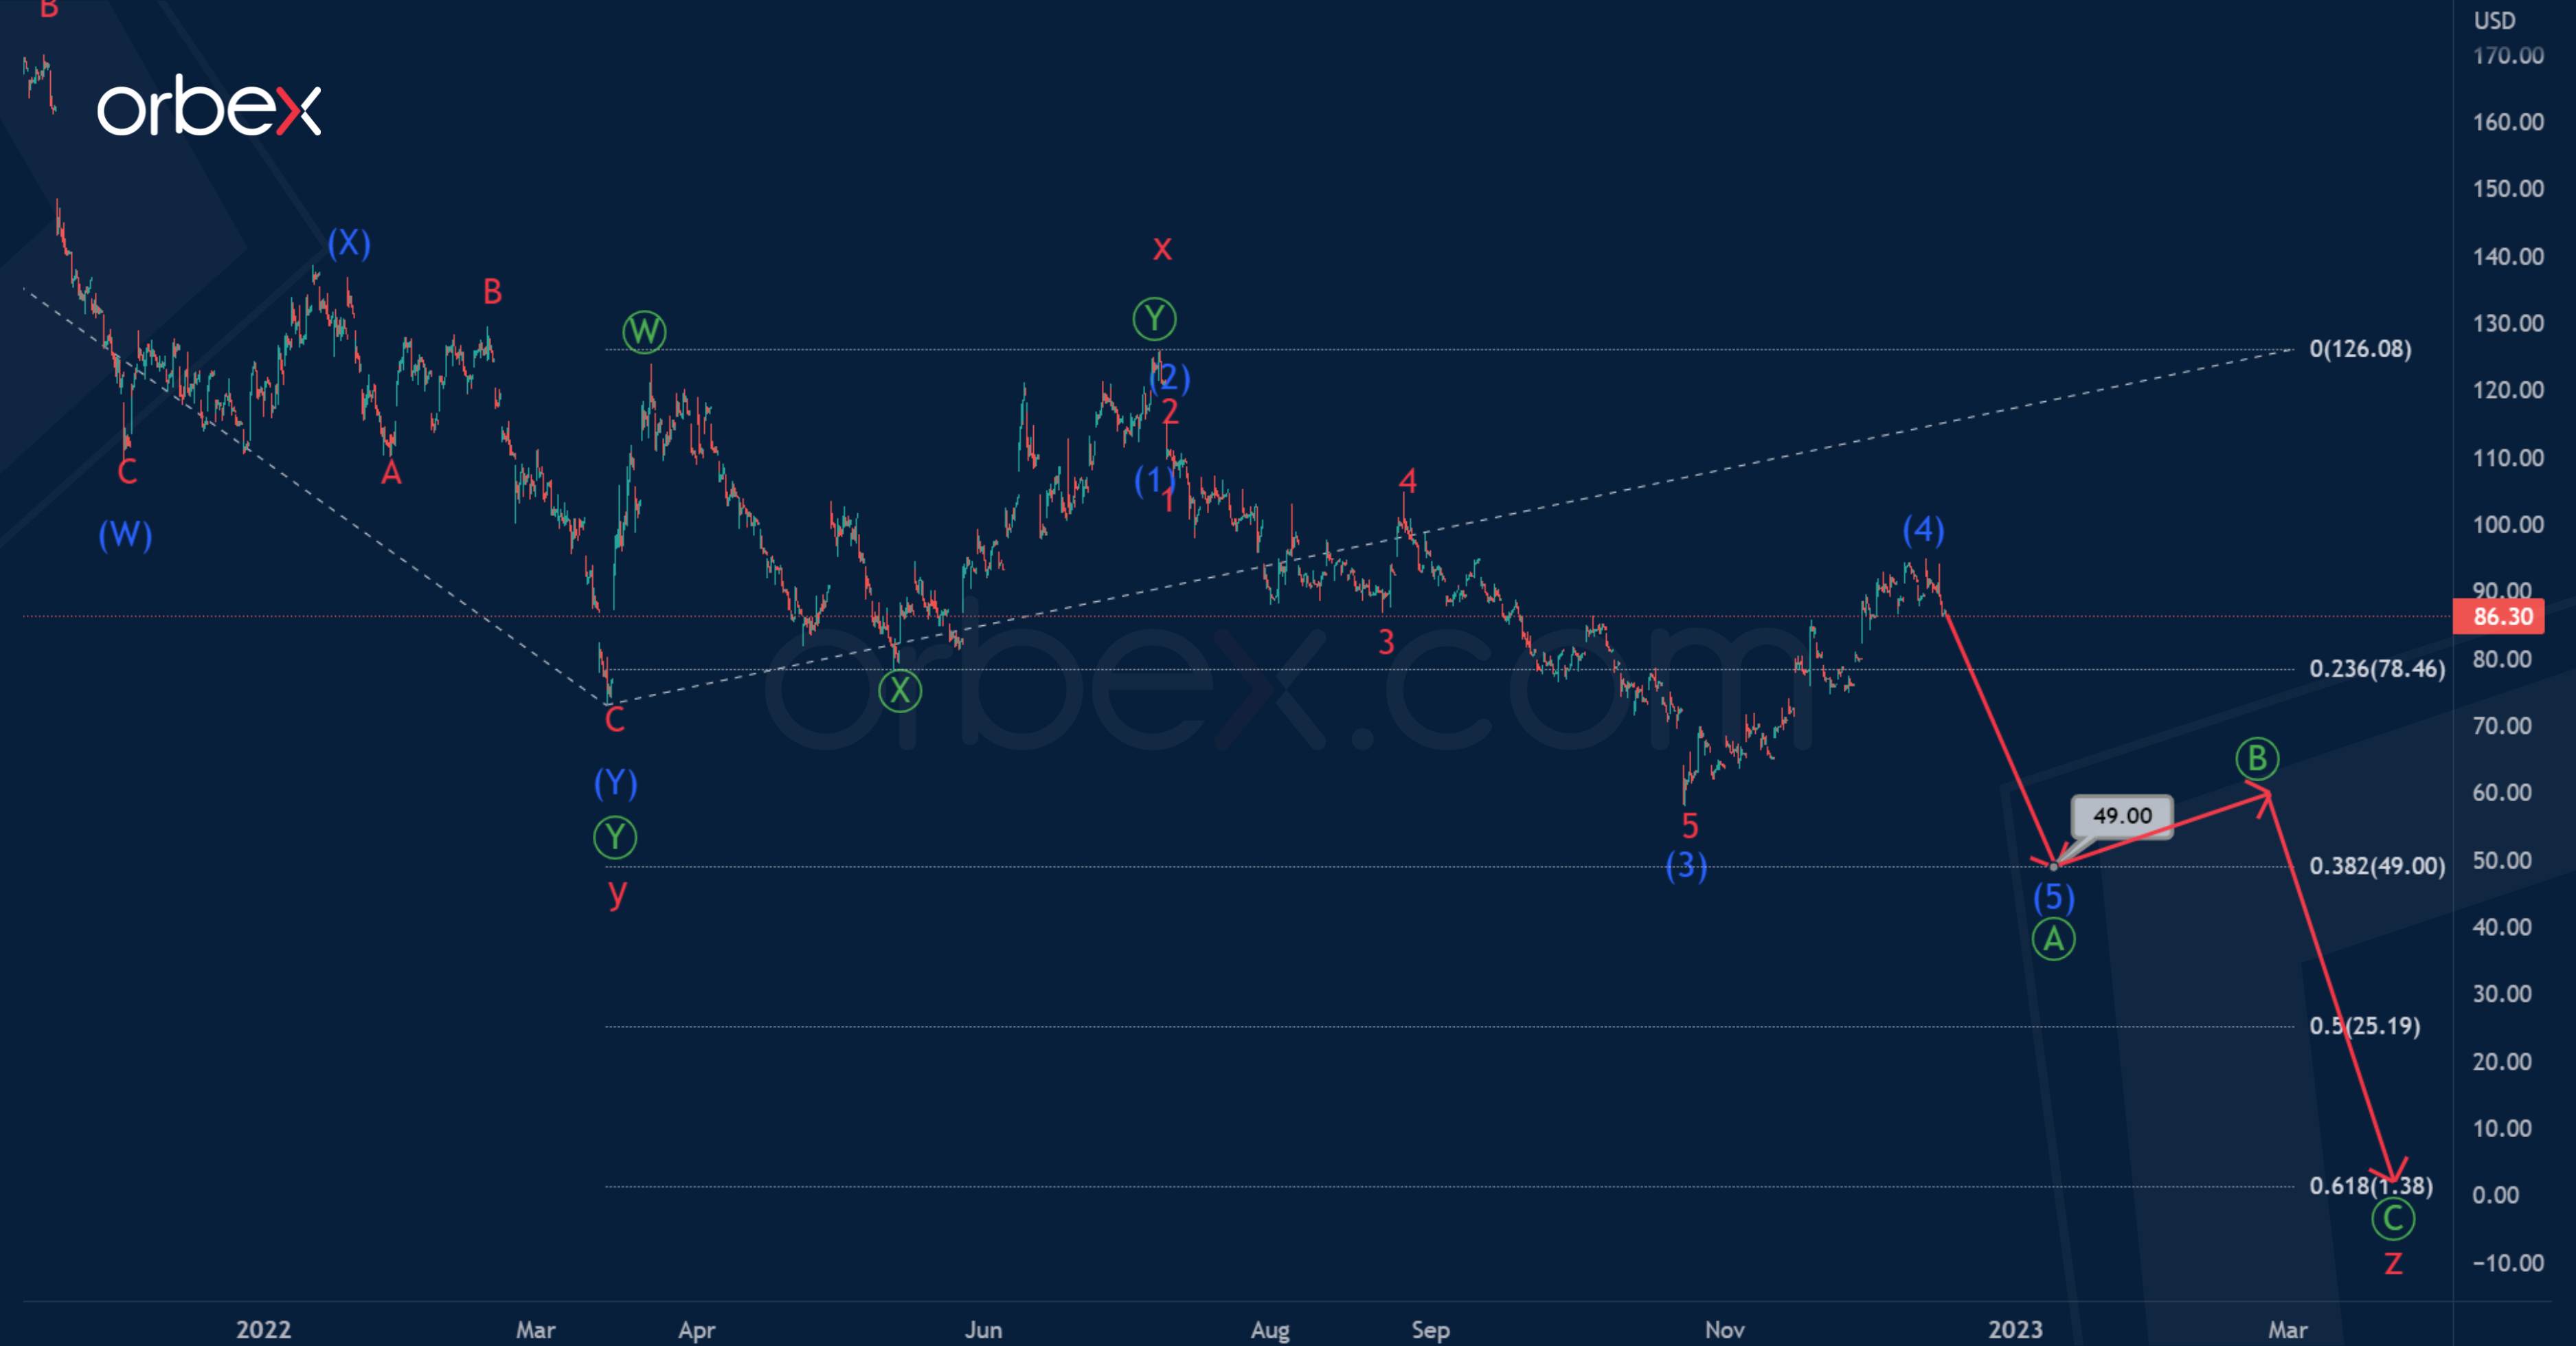
The current chart of BABA shares hints at the construction of a bearish trend taking the form of a cycle triple zigzag w-x-y-x-z.
We see a completed actionary wave y, which is a primary double zigzag Ⓦ-Ⓧ-Ⓨ. In addition, a second small intervening wave x also representing a double zigzag.
The final actionary wave z will take the form of a primary standard zigzag Ⓐ-Ⓑ-Ⓒ.

The primary wave Ⓐ has the form of an impulse (1)-(2)-(3)-(4)-(5). For its completion, a minor sub-wave 5 is needed. Its end is expected near 49.00. At that level, wave z will be at 38.2% of wave y. Then we can expect a small correction in the wave Ⓑ.
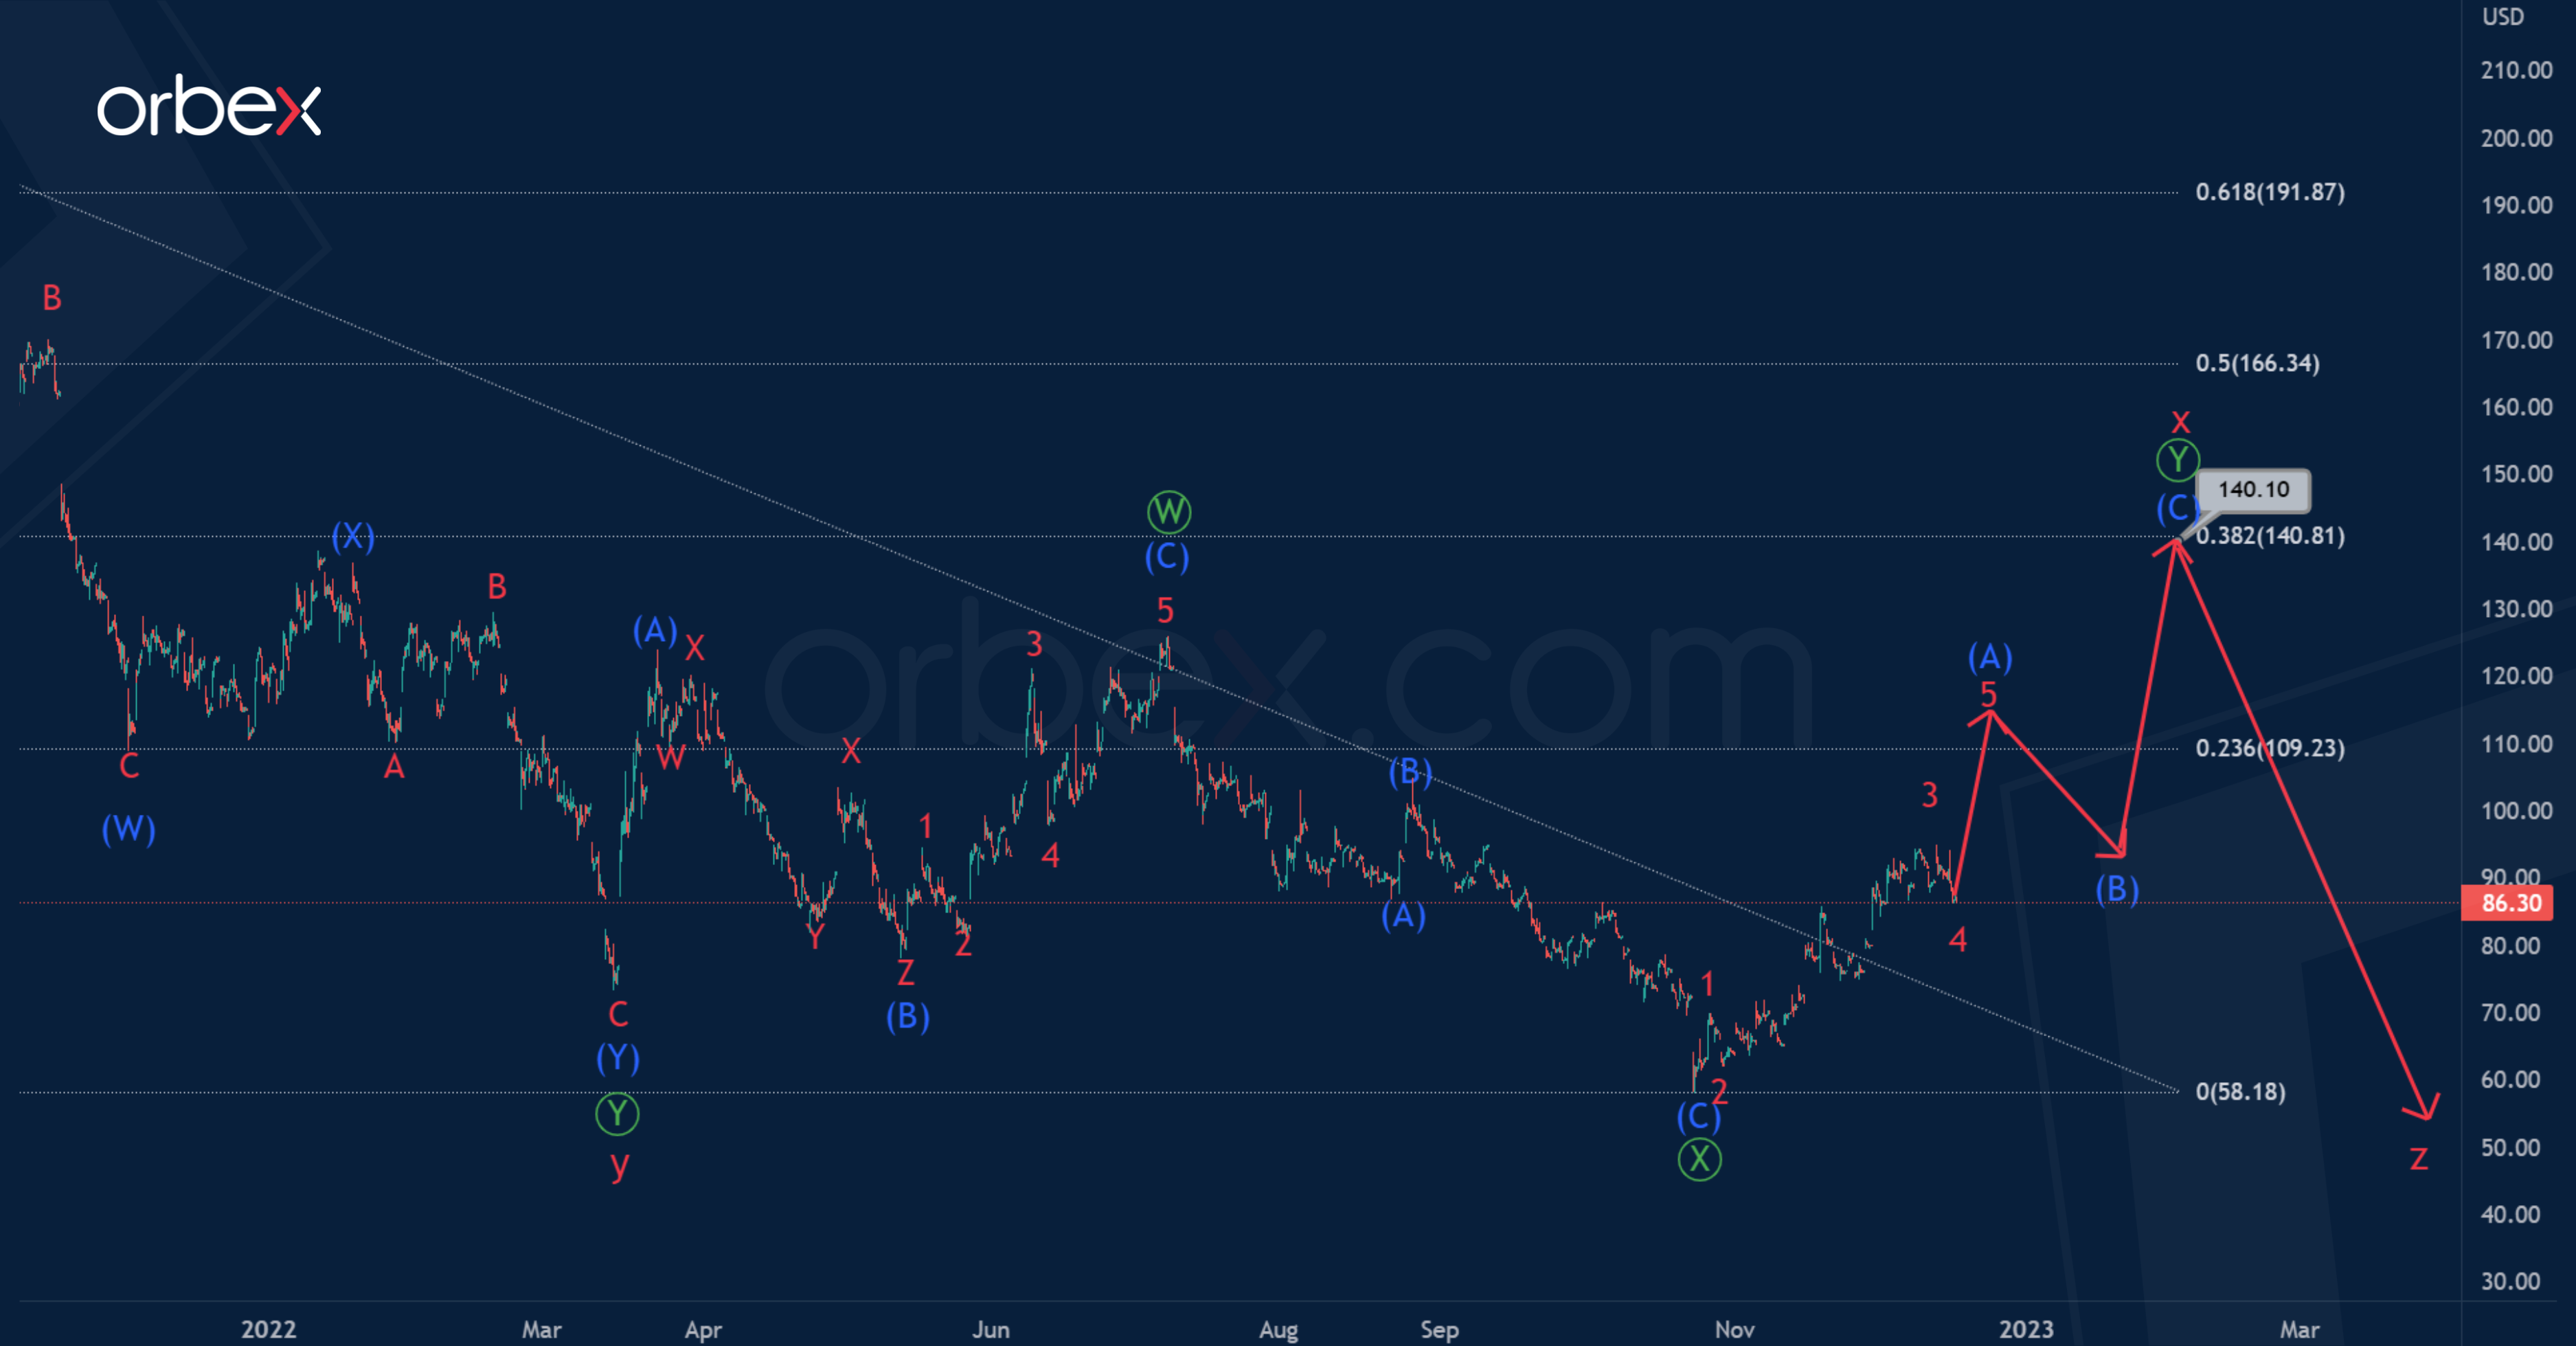
The second chart hints that the formation of the reactionary intervening wave x is not completed. Here it will take the form of a double zigzag of the primary degree Ⓦ-Ⓧ-Ⓨ. The first two zigzag sub-waves Ⓦ-Ⓧ look finished.
Now the price is in the wave Ⓨ. This wave will take a standard zigzag structure of the intermediate degree (A)-(B)-(C), as shown in the chart.
At the level of 140.10, cycle intervening wave x will be at 38.2% of actionary wave y.

![Credit Card 160×600 [EN]](https://assets.iorbex.com/blog/wp-content/uploads/2023/06/13144507/Blog-Banner_EN-Banner_160X600X2.webp)