
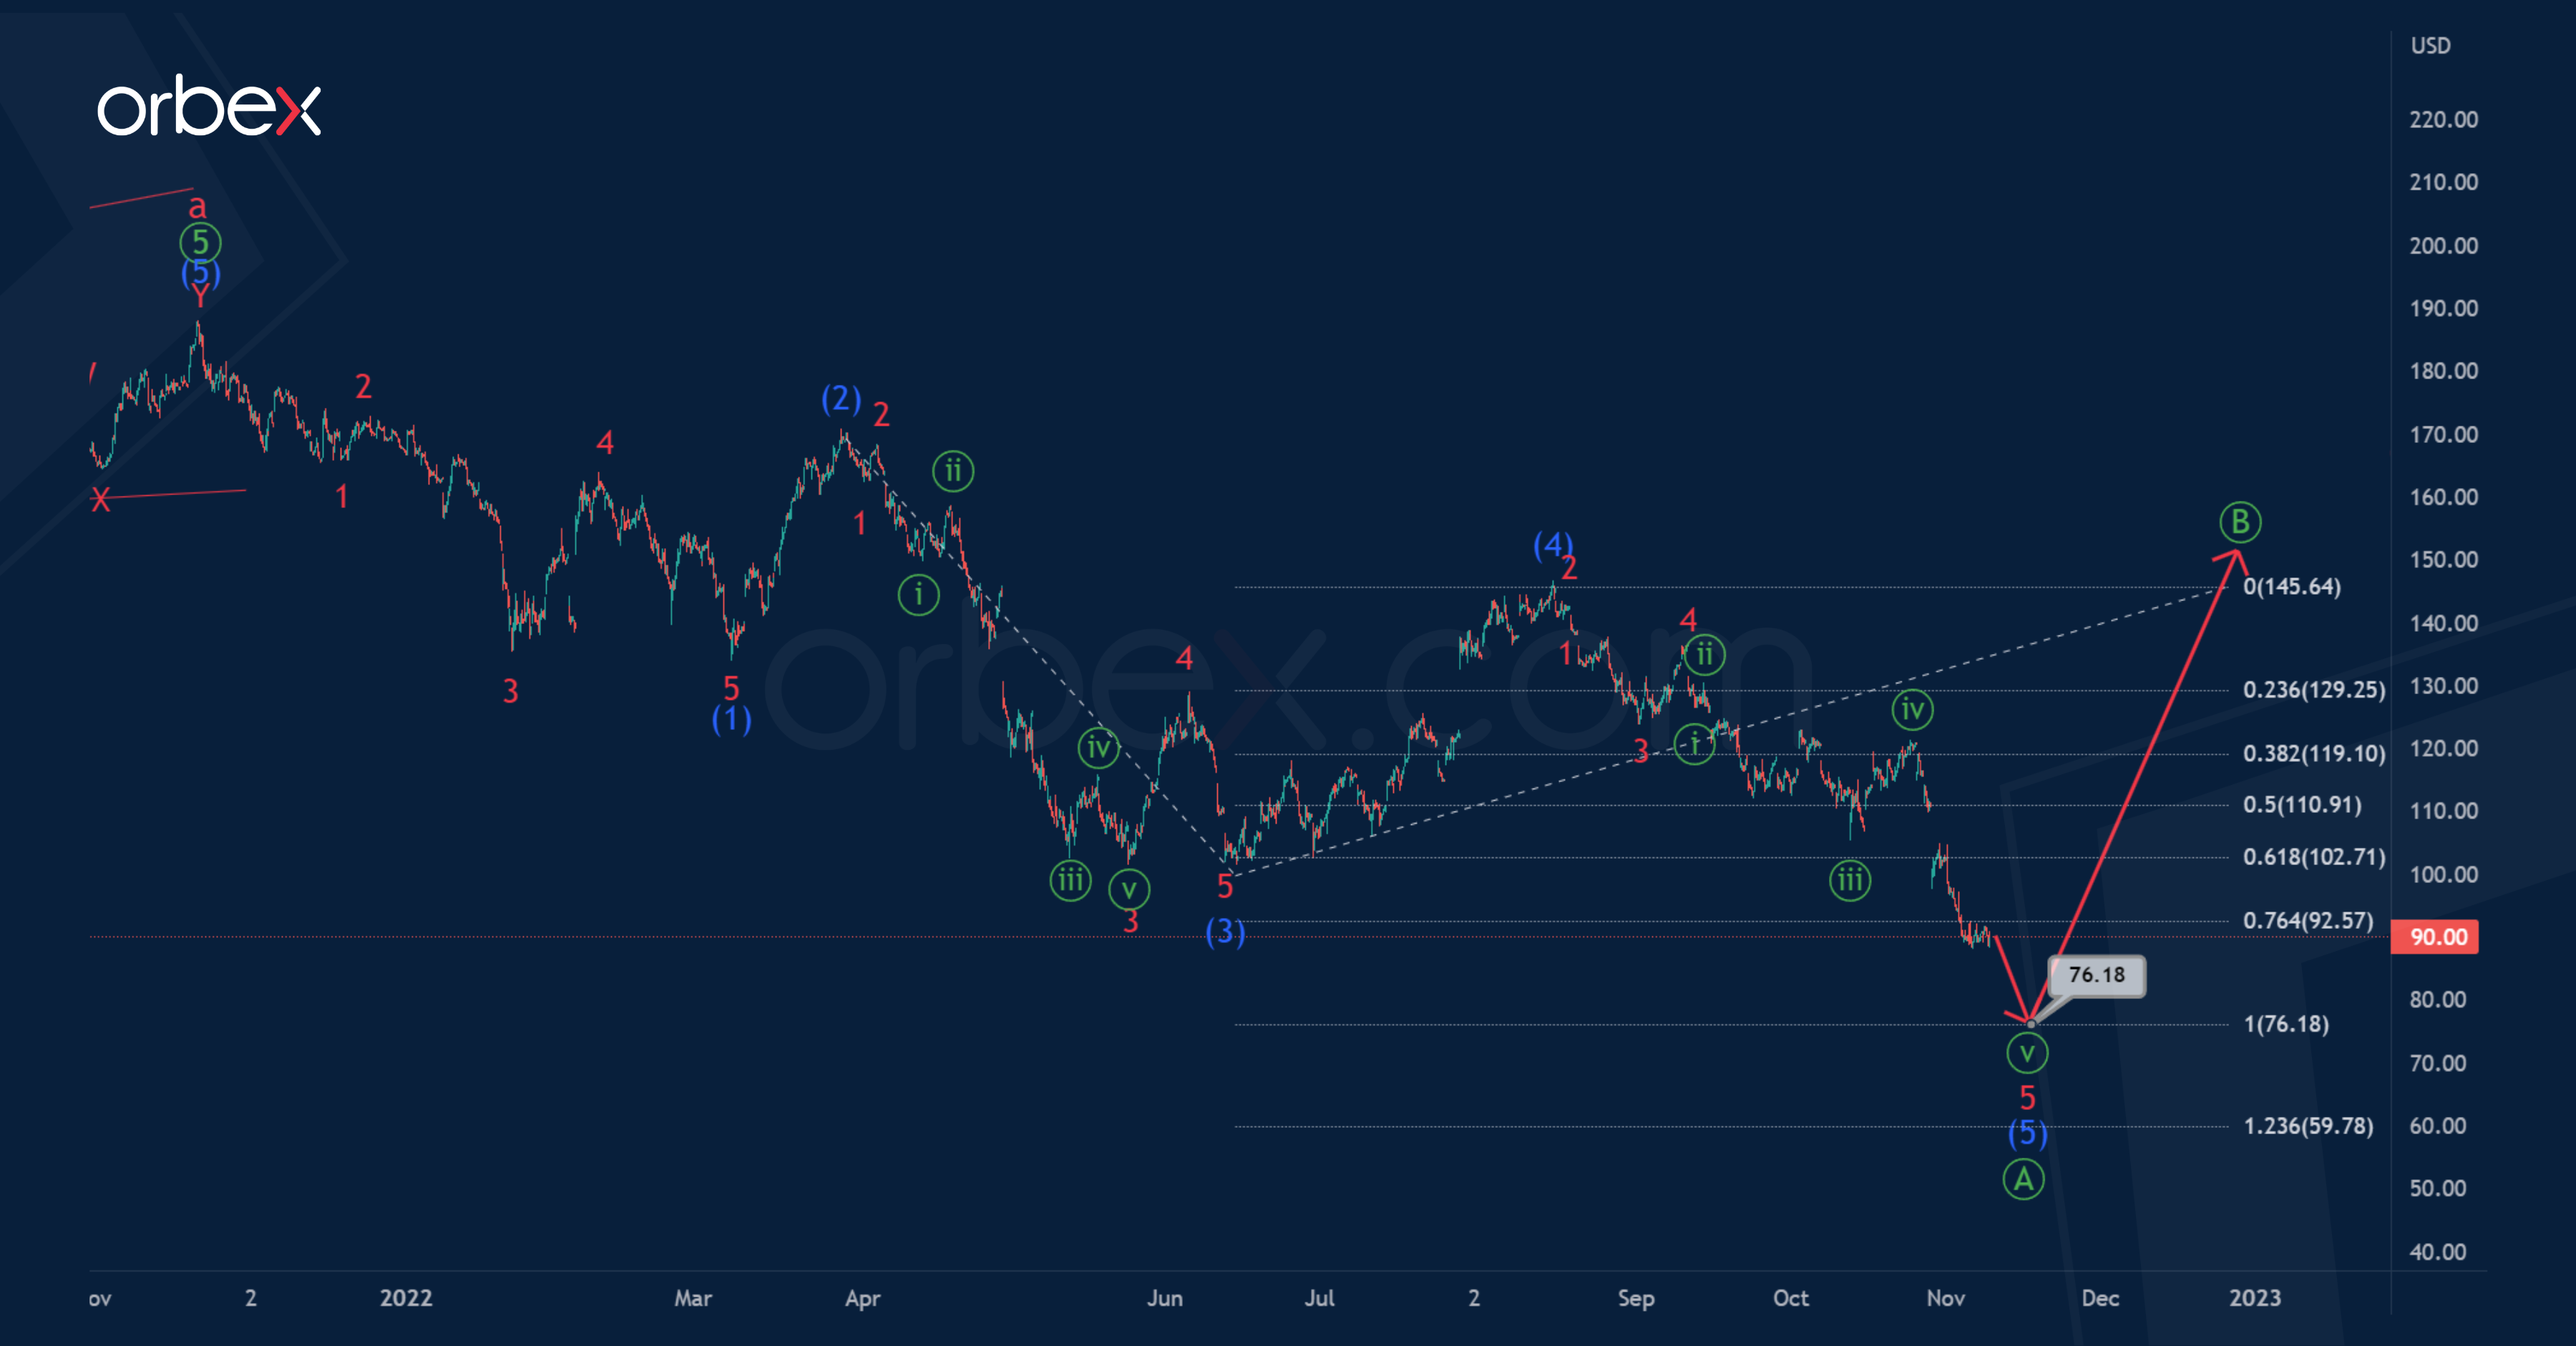
The structure of AMZN prices shows the development of a corrective trend. This is a zigzag which consists of sub-waves a-b-c of the cycle degree. Perhaps at the end of last year, the market completed the formation of the first major wave a.
After the end of the impulse growth, prices began to decline. This could indicate the beginning of a bearish correction wave b. It could take the form of a zigzag Ⓐ-Ⓑ-Ⓒ of the primary degree.
Soon, we could see prices fall in the final intermediate wave (5) of the leading diagonal Ⓐ to 76.18. At that level, wave (5) will be at 100% of previous impulse (3).

After the wave ends, we expect stocks’ growth in the primary correction Ⓑ.
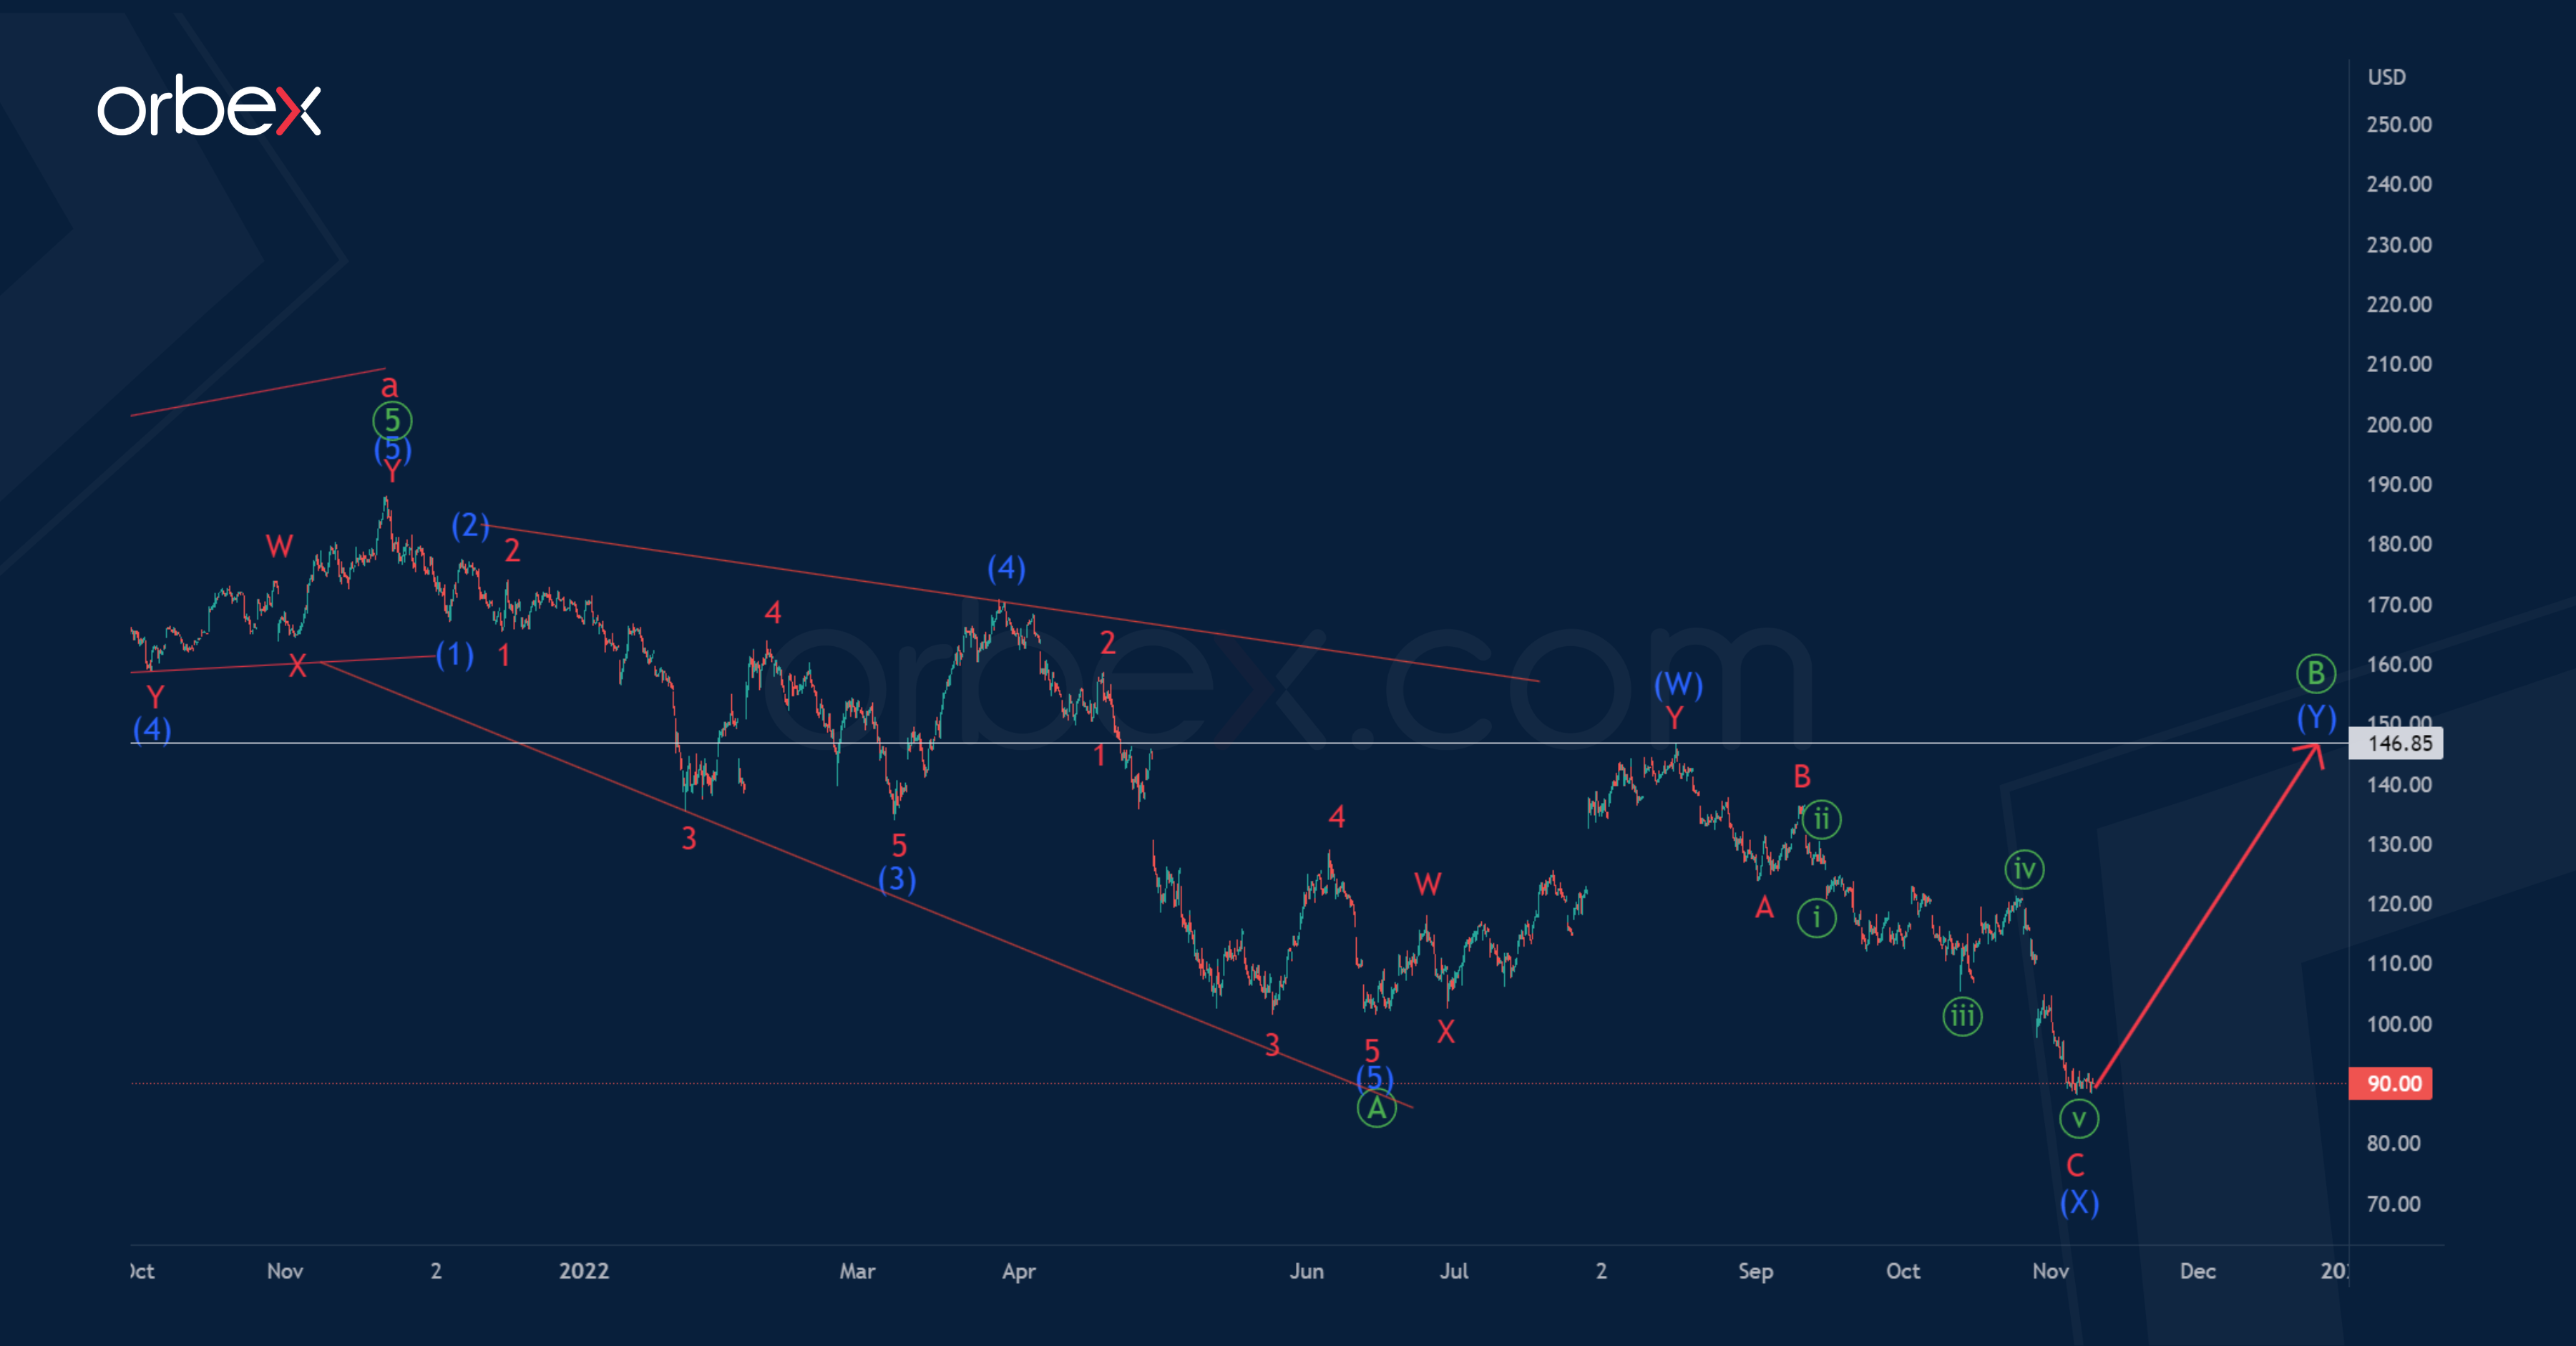
An alternative scenario is possible in which the market has completed the formation of the primary wave Ⓐ. As in the first variant, it has the form of a leading diagonal (1)-(2)-(3)-(4)-(5).
In this case, in the last section of the chart, we see a price increase in a sideways correction Ⓑ.
It is assumed that the correction wave Ⓑ will take the form of an intermediate double three (W)-(X)-(Y). The actionary wave (W) is also a double zigzag W-X-Y of a lesser degree.
Perhaps the second intervening wave (X) has also come to an end, so an upward movement in the final wave (Y) to a maximum of 146.85 is expected in the near future.

![Credit Card 160×600 [EN]](https://assets.iorbex.com/blog/wp-content/uploads/2023/06/13144507/Blog-Banner_EN-Banner_160X600X2.webp)