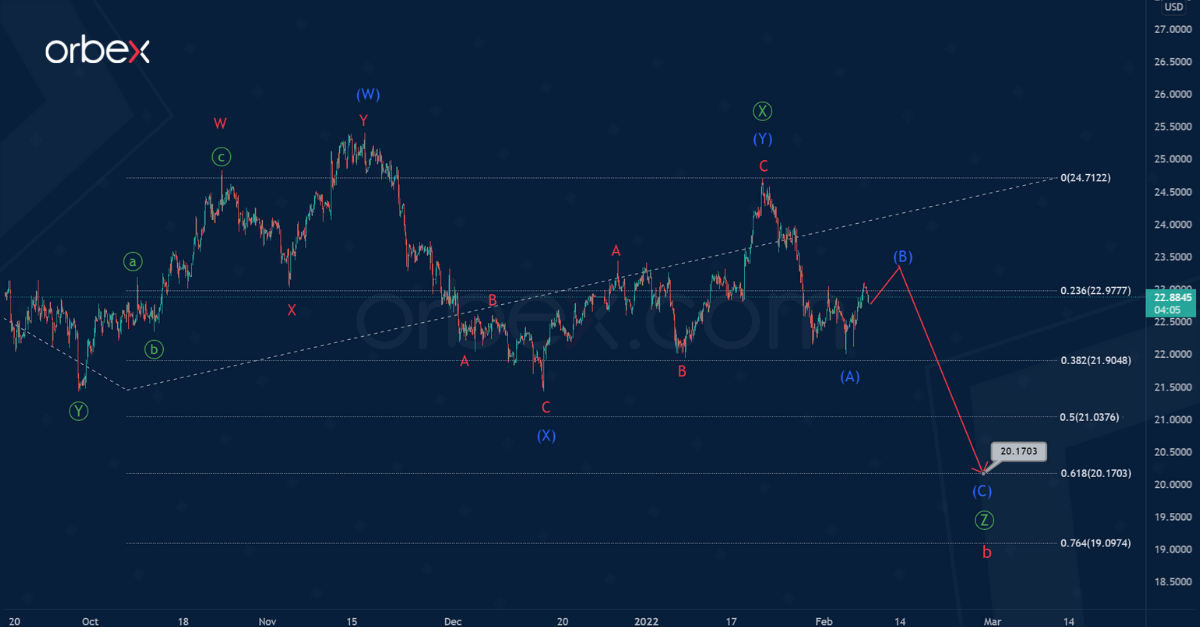
The XAGUSD pair shows the development of a long-term correction wave b, which forms a pullback to the bullish impulse a.
Wave b is a triple zigzag and consists of primary sub-waves Ⓦ-Ⓧ-Ⓨ-Ⓧ-Ⓩ. The first four parts of this triple zigzag have ended. So now we see the construction of the final wave Ⓩ.
Wave Ⓩ, like the sub-waves Ⓦ and Ⓨ, is a simple bearish zigzag and includes intermediate sub-waves (A)-(B)-(C). Wave (A) is fully complete, (B) is almost complete.

In the near future, when the market fully forms a correction (B), there could be a continuation of the decline in the impulse wave (C) to the 20.170 area. At that level, the entire wave Ⓩ will be at 61.8% of wave Ⓨ.
The probability of completing the decline at the level of the golden ratio is quite high. Subsequently, at the end of the entire wave b, there might be a growth of the market.
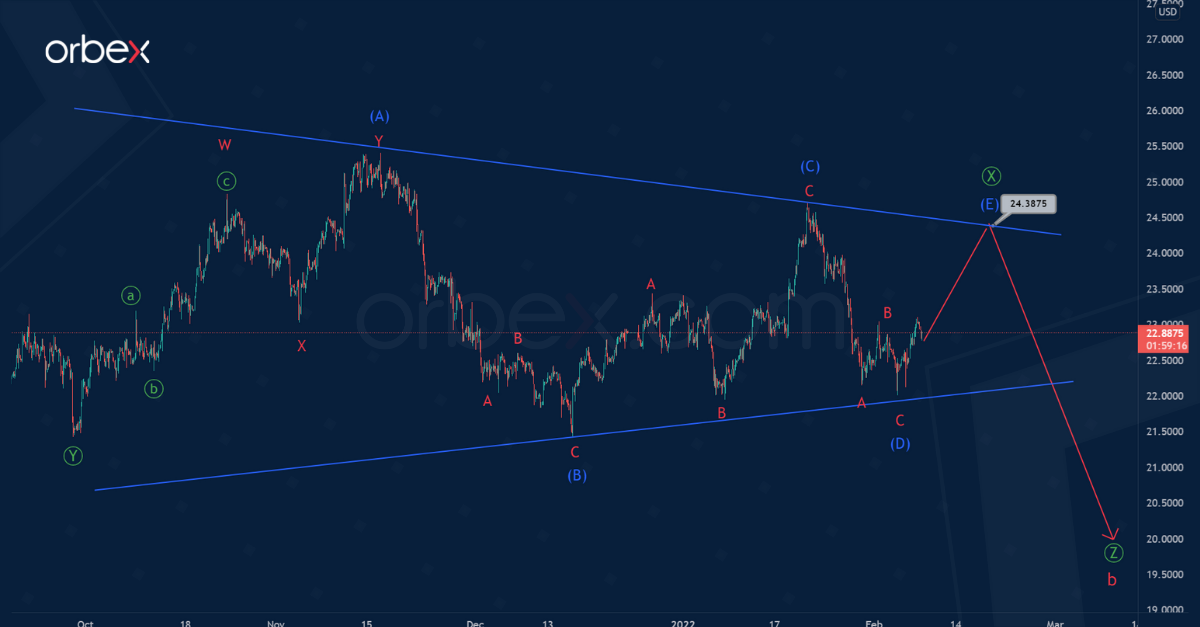
An alternative option indicates that the correction intervening wave Ⓧ will take the form of a contracting horizontal triangle (A)-(B)-(C)-(D)-(E). The internal structure of all the sub-waves of this triangle is visible in the chart.
The sub-wave (A) is a double zigzag, (B) is a simple bearish zigzag, (C) and (D) also took the form of simple zigzags. It is likely that the final sub-wave (E) of this triangle is developing now.
This wave can take the form of any correction wave, but most likely we will see a simple zigzag or a combination of zigzags. The growth in wave (E) could continue to the level of 24.38. This is located on the resistance line drawn through the vertices of the sub-waves (A) and (C).
Then, the final wave Ⓩ could complete the bearish trend.
Looking to trade more than just metals? Check out the different types of financial instruments!!

