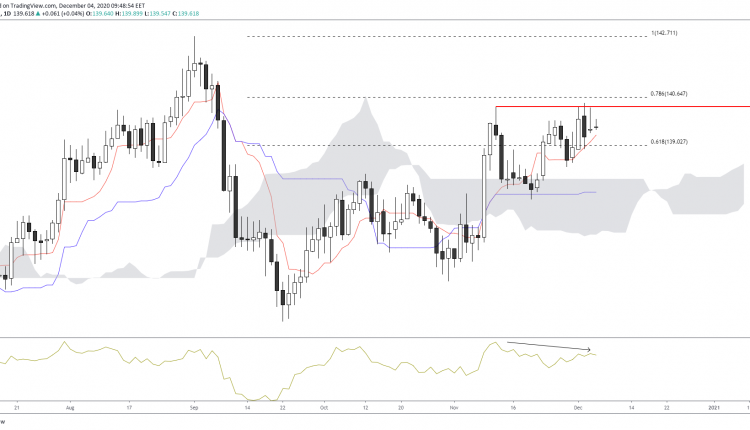
GBPJPY has been trading on a bullish tone from the recent highs witnessed in September. The pair has currently hit a resistance level from the previous peak formed last month.
The bearish divergence noted on the momentum indicator suggests a slow down in the bullish rally for now. Prices are currently trading within the 61.8% and 78.6% of the 142.71/113.06 upside Fibonacci leg.
Another attempt at the upside would first need the resistance to break, and then a move towards the 78.6% would be achievable.
However, a move down past the 61.8% leaves a risk of cloud engulfment and further progression towards lower levels.

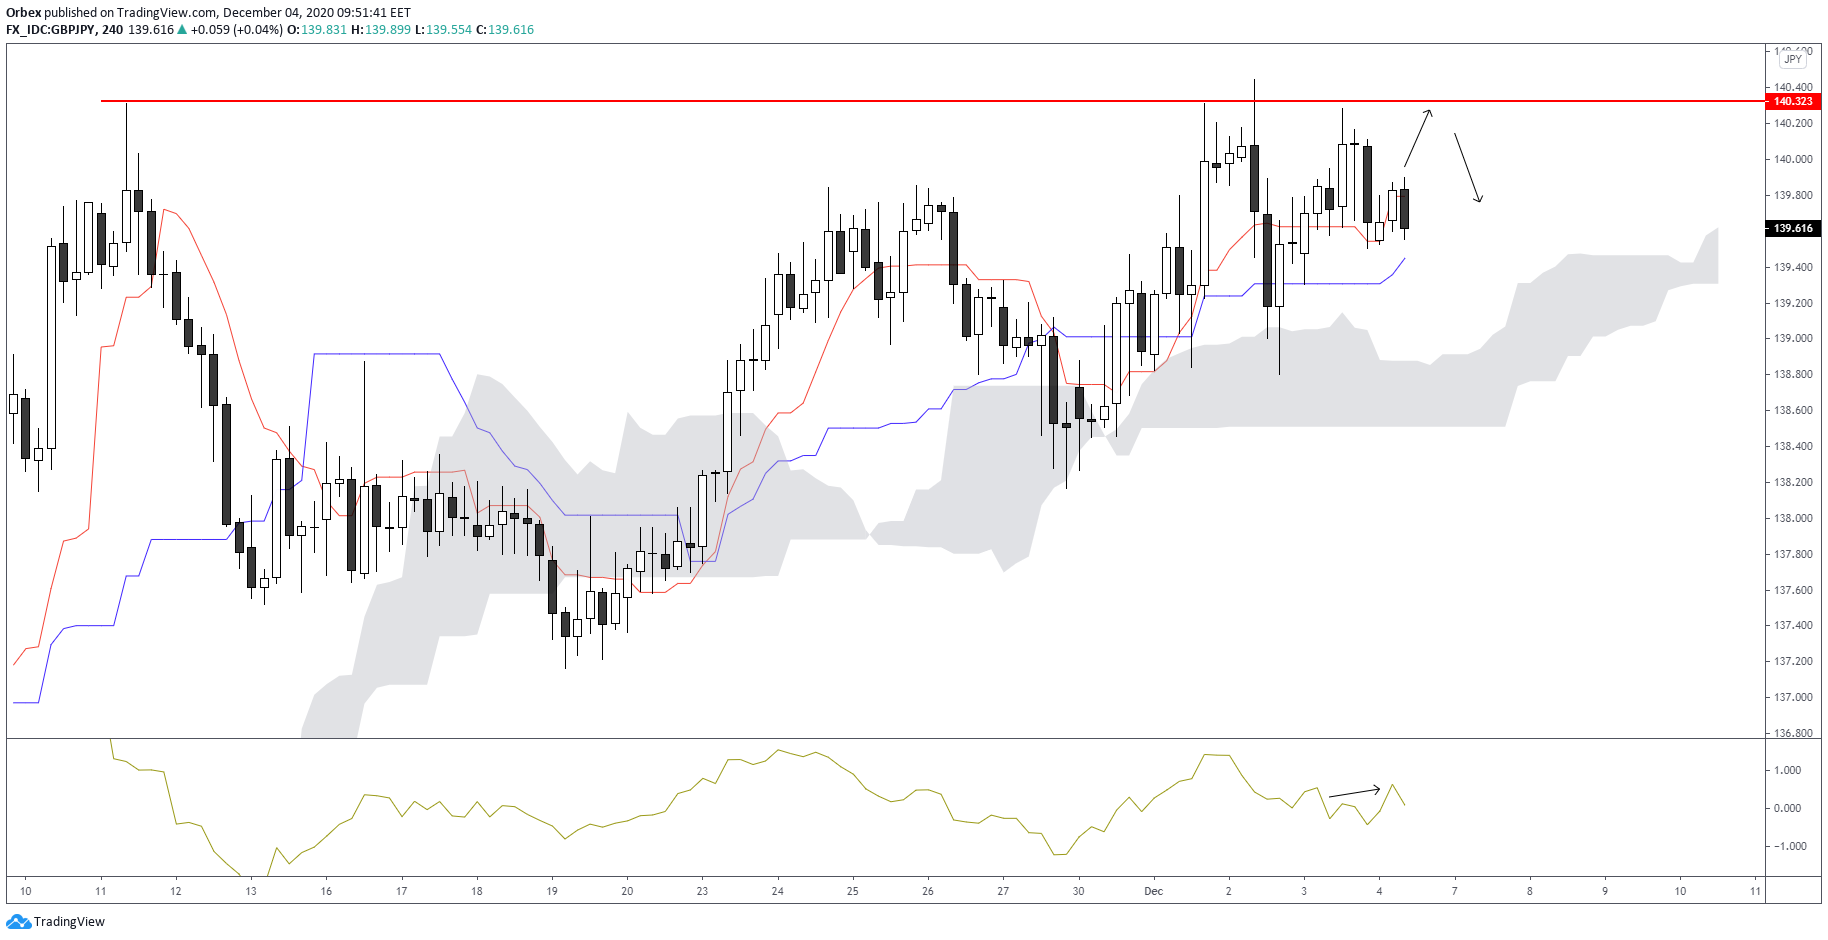
A shorter intraday outlook highlights the long-term resistance level which is halting advancement to the upside.
A potential test at the said level could see prices bounce down towards the Ichimoku cloud. The current hidden bearish divergence could weigh in on prices, as the candlesticks trade between the base and conversion lines.
Should bears move in, then prices could retain last month’s lows at the 137 region by the end of this month.

