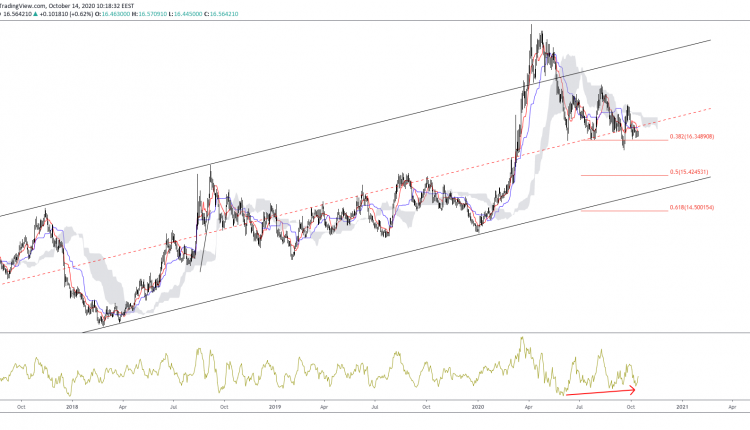
USDZAR currently sees prices trading below the Ichimoku cloud, indicating a descending tendency. Even though prices have been trading in an ascending channel since 2018, the current bias leans towards the downside.
A second test at the start of 2020 led to support at the lower channel, which in turn propelled prices to break out of the upper channel. As we then witnessed a mean reversion, support is now possible at the median regression.
Should prices fall lower to the 38.2% of the 11.507/19.341 upside Fibonacci leg, this would invalidate the recent bullish divergence on the momentum indicator.
The next targets would then be a fall to $15 and $14, which would be a confluence of the lower ascending channel.

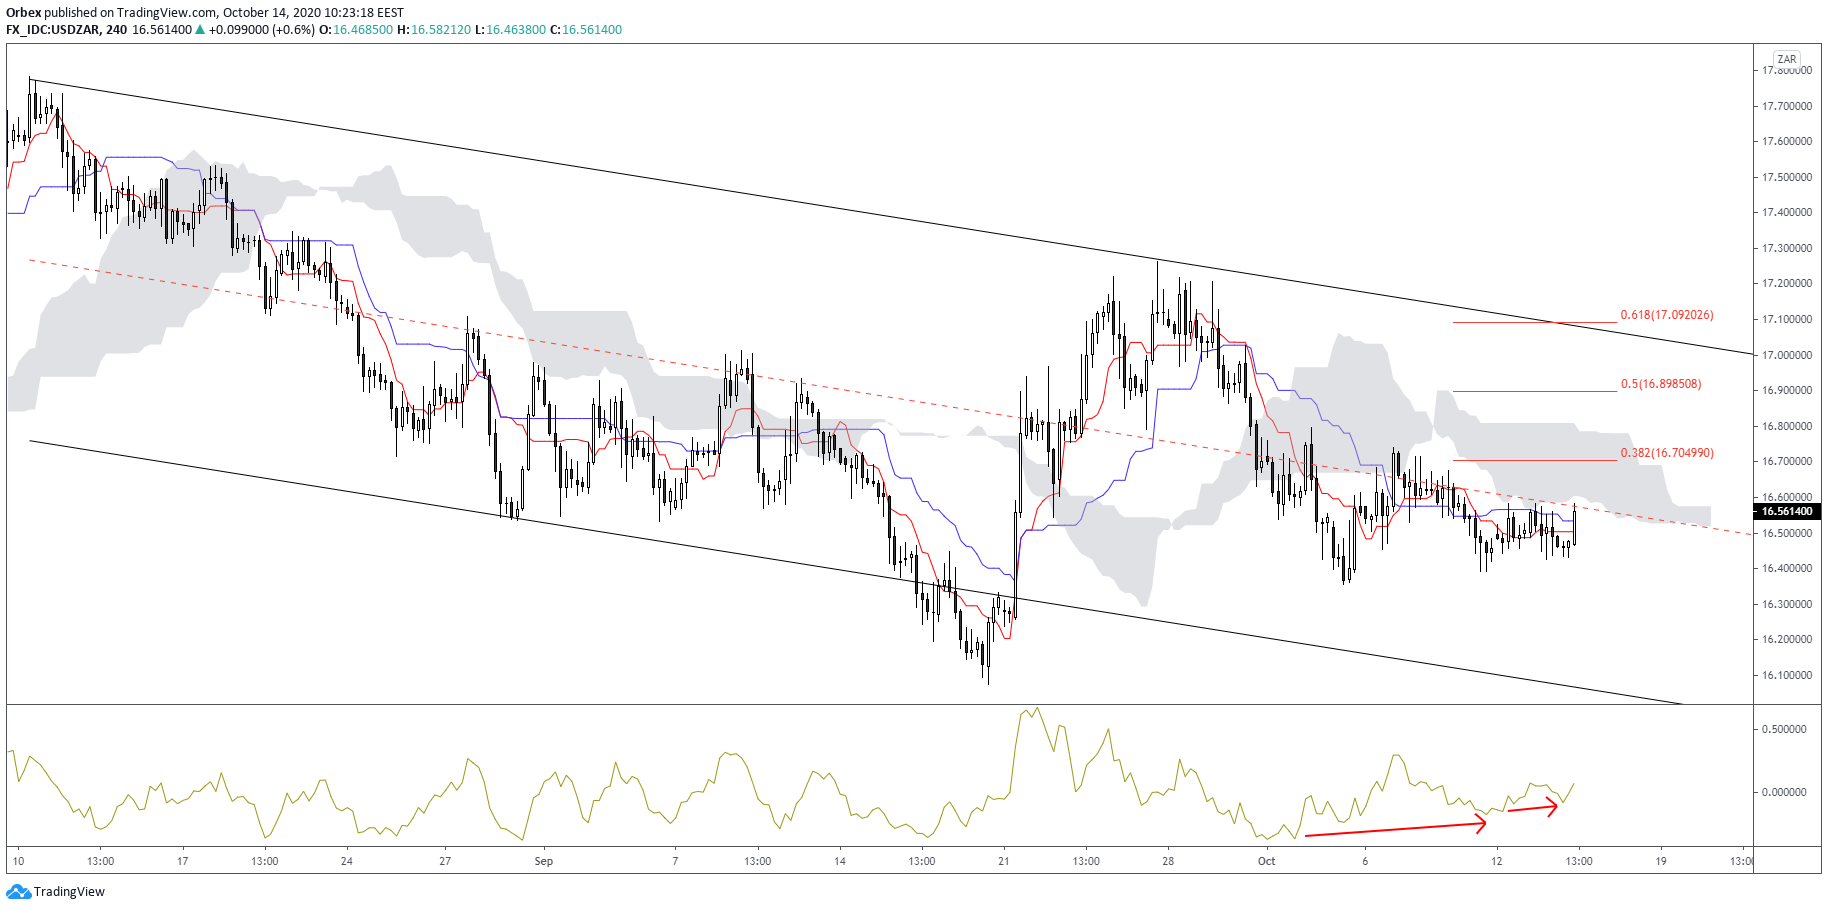
A look at the 4-hour chart indicates that the pair is trading in a descending channel. The short-term outlook hints to a double bullish divergence which could bring prices above the median regression. This is currently where a resistance barrier is in place.
A previous attempt to fall below the channel was met with a move towards the upper channel at the end of September. Should the divergence come into fruition, the next target would be the 38.2% Fibonacci area.
Prices would have then pierced the lower border of the cloud, making room for the 50% and 61.8% regions. With the latter being a confluence with the upper channel.

