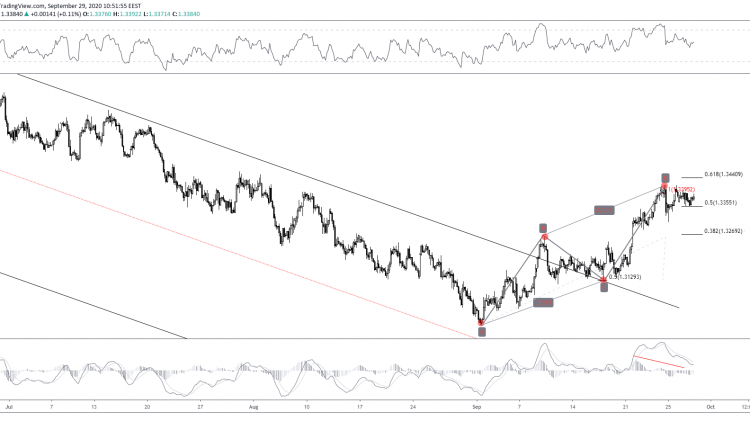
USDCAD floats above the 50% Fibonacci retracement of the 1.3717-1.2994 leg, at 1.3355.
Sellers capped gains for now as prices seem settled around the round resistance of 1.34.
Both the 100% extension of the AB=CD pattern and the resistance indicates a potential shift. With prices remaining below the said barrier, bears could re-initiate selling activity. In addition, the sentiment seems supported by the MACD’s divergence so far.
A downside break of the 1.3355 region could prove pivotal for the medium-term direction of the loonie. Contrary, an upside attempt, could only be short-lived as the 61.8% Fibonacci will stand firm on bulls’ way.

Closing in, we can see how the Fibonacci time zone supports the cluster both in B and D sub-patterns. On another note, both the RSI and the MACD provide a bearish setup.
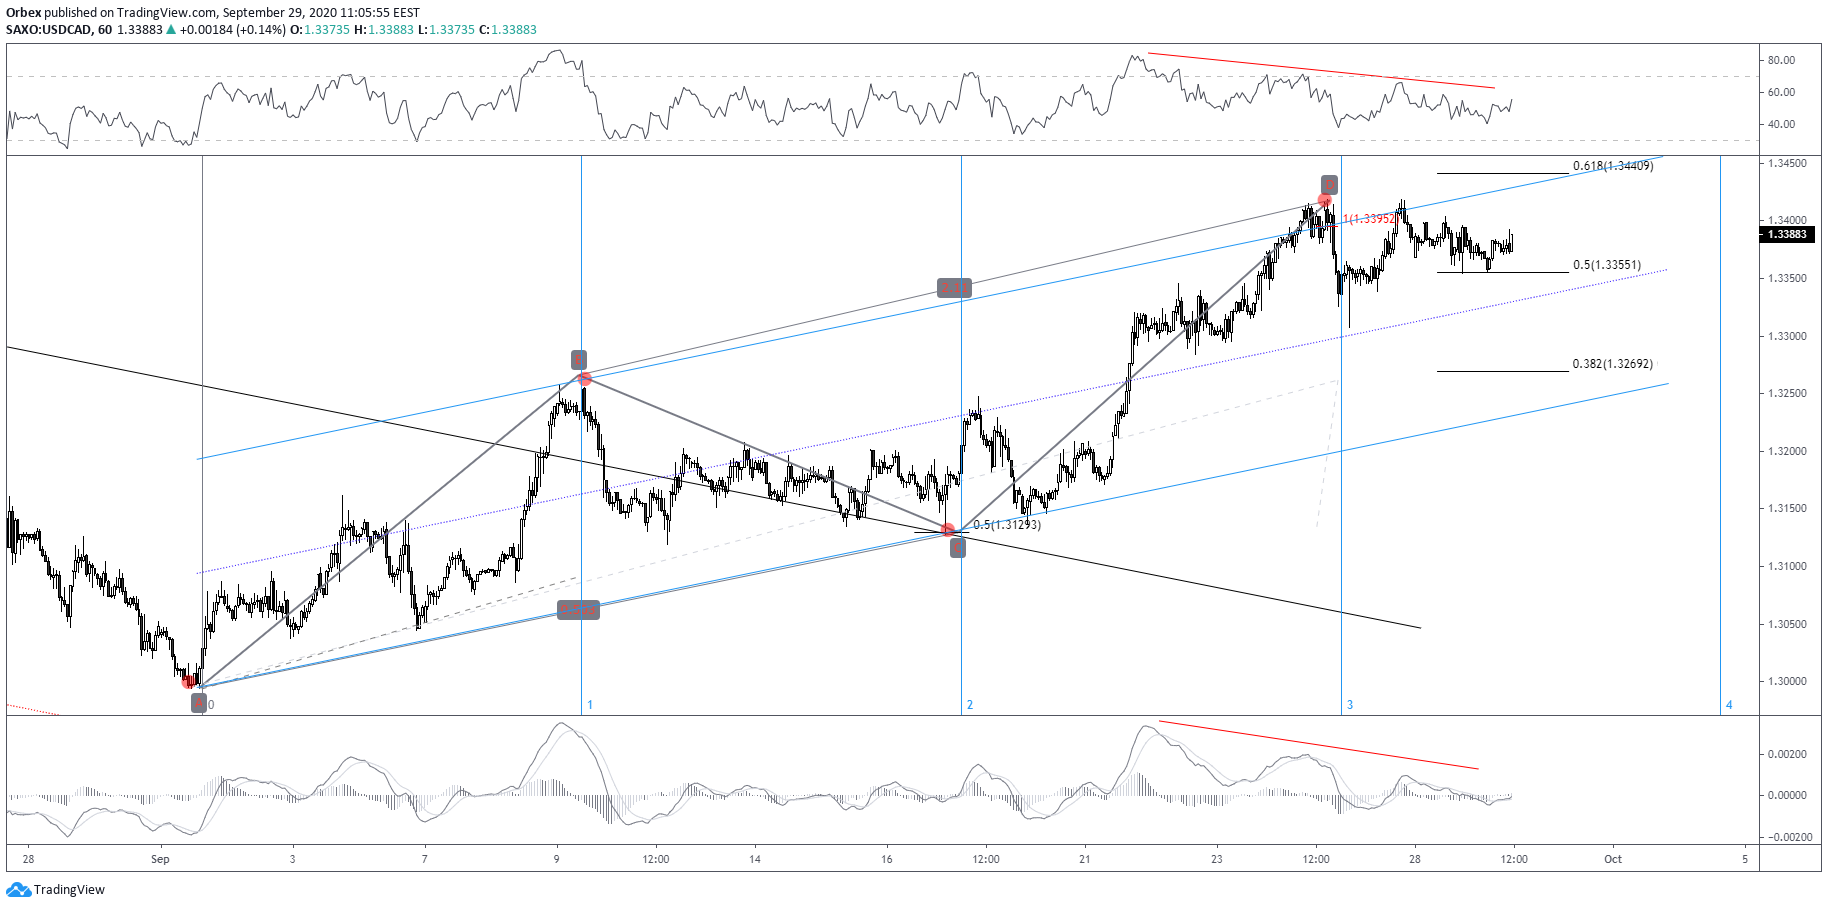
Despite missing the golden ratio of the bearish leg at 1.3440, a bullish attempt could be seen once again. However, it could drag the pair to a 1.3440 rejection around Oct 2. This is where the 100% and 400% Fibonaccis could form a 2D cluster; keep in mind that the AB=CD pattern was completed already though.
In a 2D cluster case, we expect the median regression of the ascending channel to hold firm during bearish attempts. However, chances of a lower channel bounce are not disregarded either.
Breaking below the lower of the ascending channel is only expected to support bears. And this can occur in either case: with or without another upside leg.
How do you feel the CAD will fare in the coming weeks? Open your Orbex account and trade now!

![Credit Card 160×600 [EN]](https://assets.iorbex.com/blog/wp-content/uploads/2023/06/13144507/Blog-Banner_EN-Banner_160X600X2.webp)