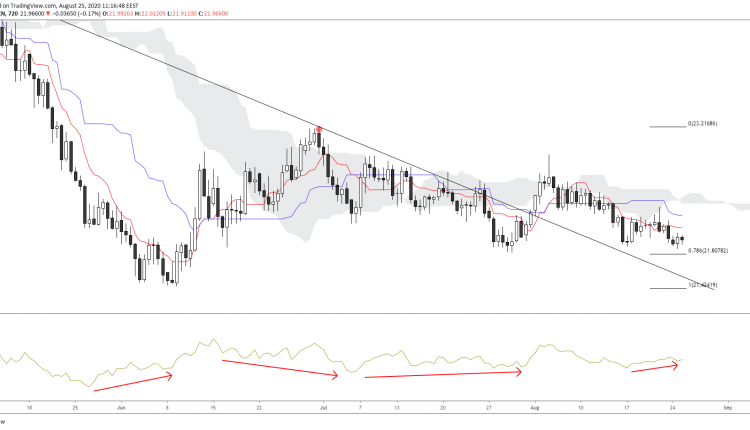
USDMXN has witnessed a bearish move from its recent spike of almost $23 on Aug 04. The pair created a bullish move after hitting support at 21.82 which was at 78.6% of the Fibonacci retracement.
Previous standard and hidden bullish divergences on the momentum indicator strongly hints to bias at the upside. From these clues a move upwards towards the Tenkan line become likely.
If prices push towards the Kijun line then the Ichimoku cloud will then show signs of engulfing. A move to the recent high of 23.22 will be the next target as the current move on the momentum indicator supports this rhetoric.
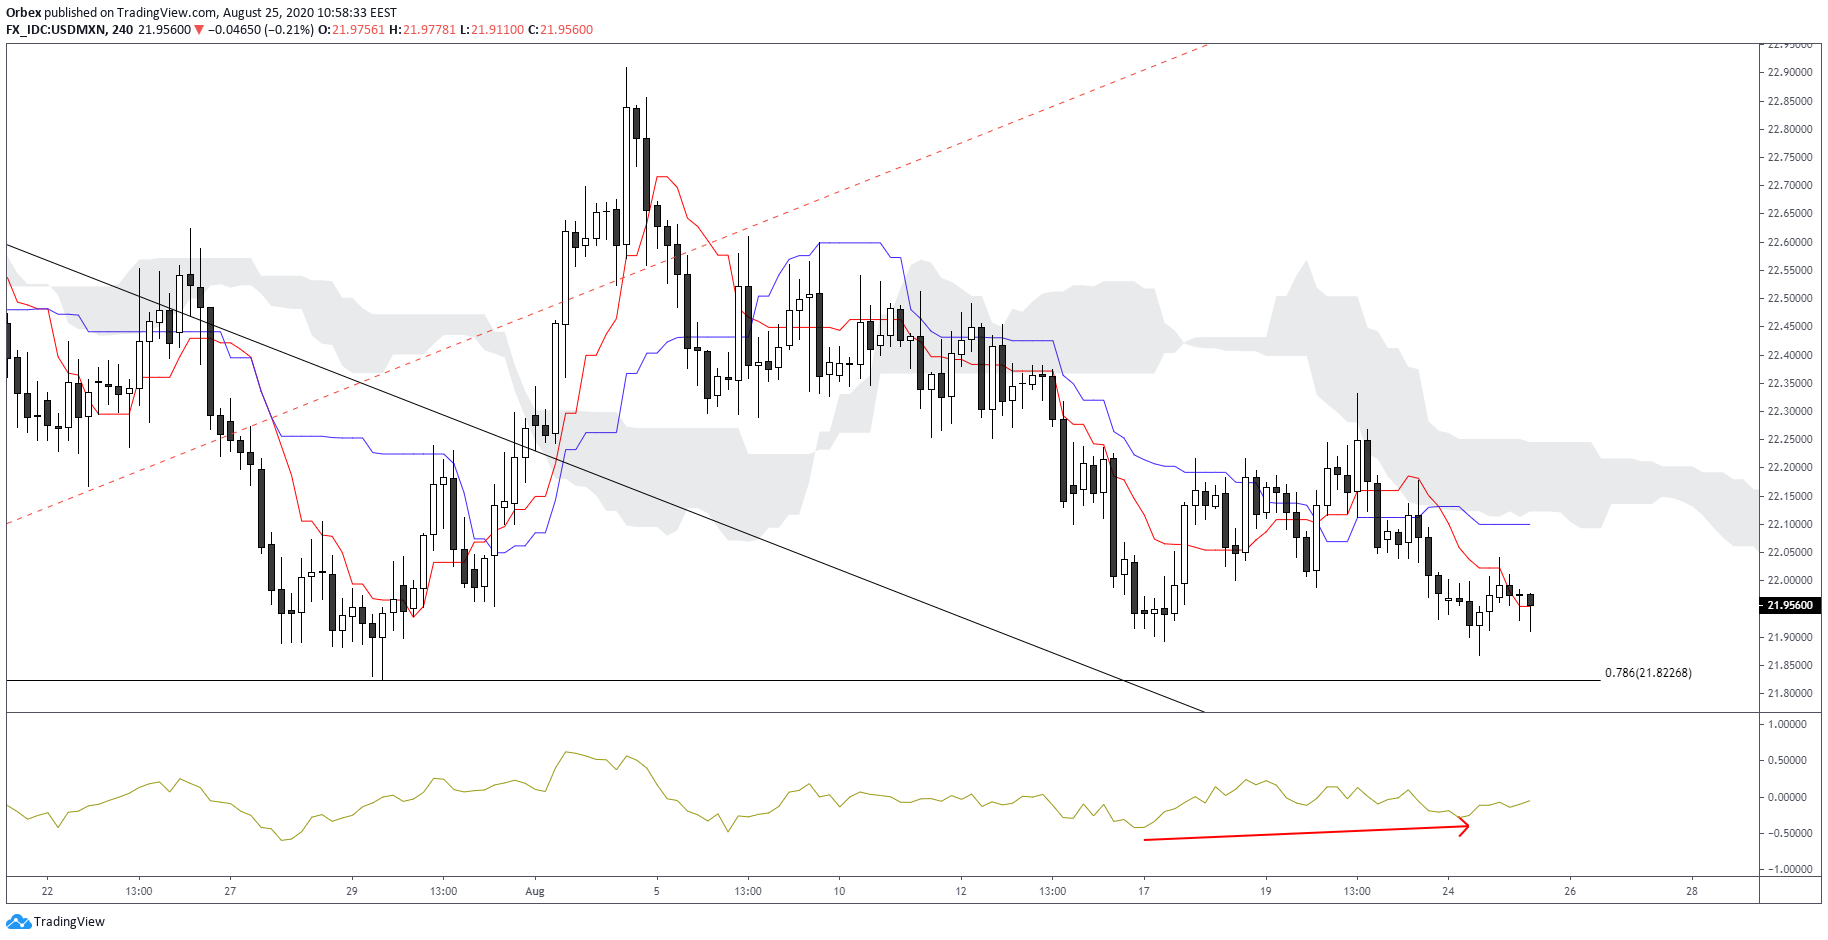

A shorter-term outlook shows further confirmation as a recent false break is seen towards the 78.6% Fibonacci retracement. From the bullish divergence on the momentum indicator, we now expect prices to fully move above the Tenkan line.
Once this occurs, then the Kijun line will be an area of significance as this will push prices up into the cloud. After this, another attempt at the recent highs can be expected.

![Credit Card 160×600 [EN]](https://assets.iorbex.com/blog/wp-content/uploads/2023/06/13144507/Blog-Banner_EN-Banner_160X600X2.webp)