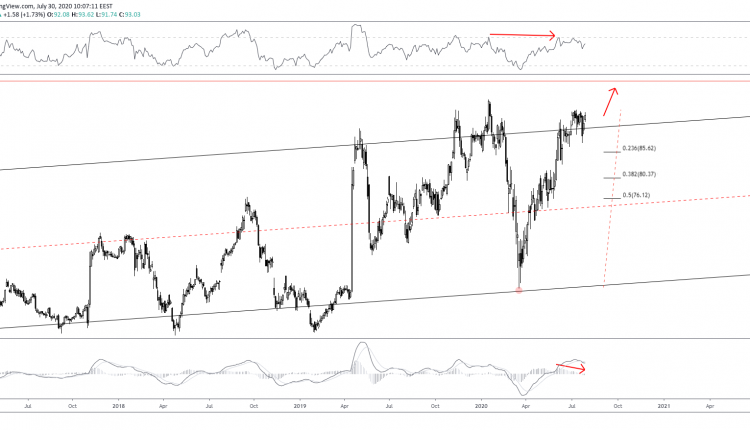
Qualcomm’s share prices spiked outside the upper regression of the $11.50-$53 channel once again.
The recent pullback from the $94.17 high registered on July 13 was only short-lived as prices retraced only down to $84.54. This is near the 23.6% Fibonacci of the $58.00-$94.17 leg, however, not at or below the critical level.
Despite looking bullish, QCOM could see a deeper retracement before breaking to all-time highs above $100.
Both the RSI (14) and MACD indicators signal a bearish bias in the long and short-term.

As seen below, the short-term outlook sees a good resistance at $96.24 top. This is the previous high marked by the Jan 16 spike. In addition, this level is in confluence with the upper regression of the $64.41-$80.64 channel, suggesting a firmer market top.
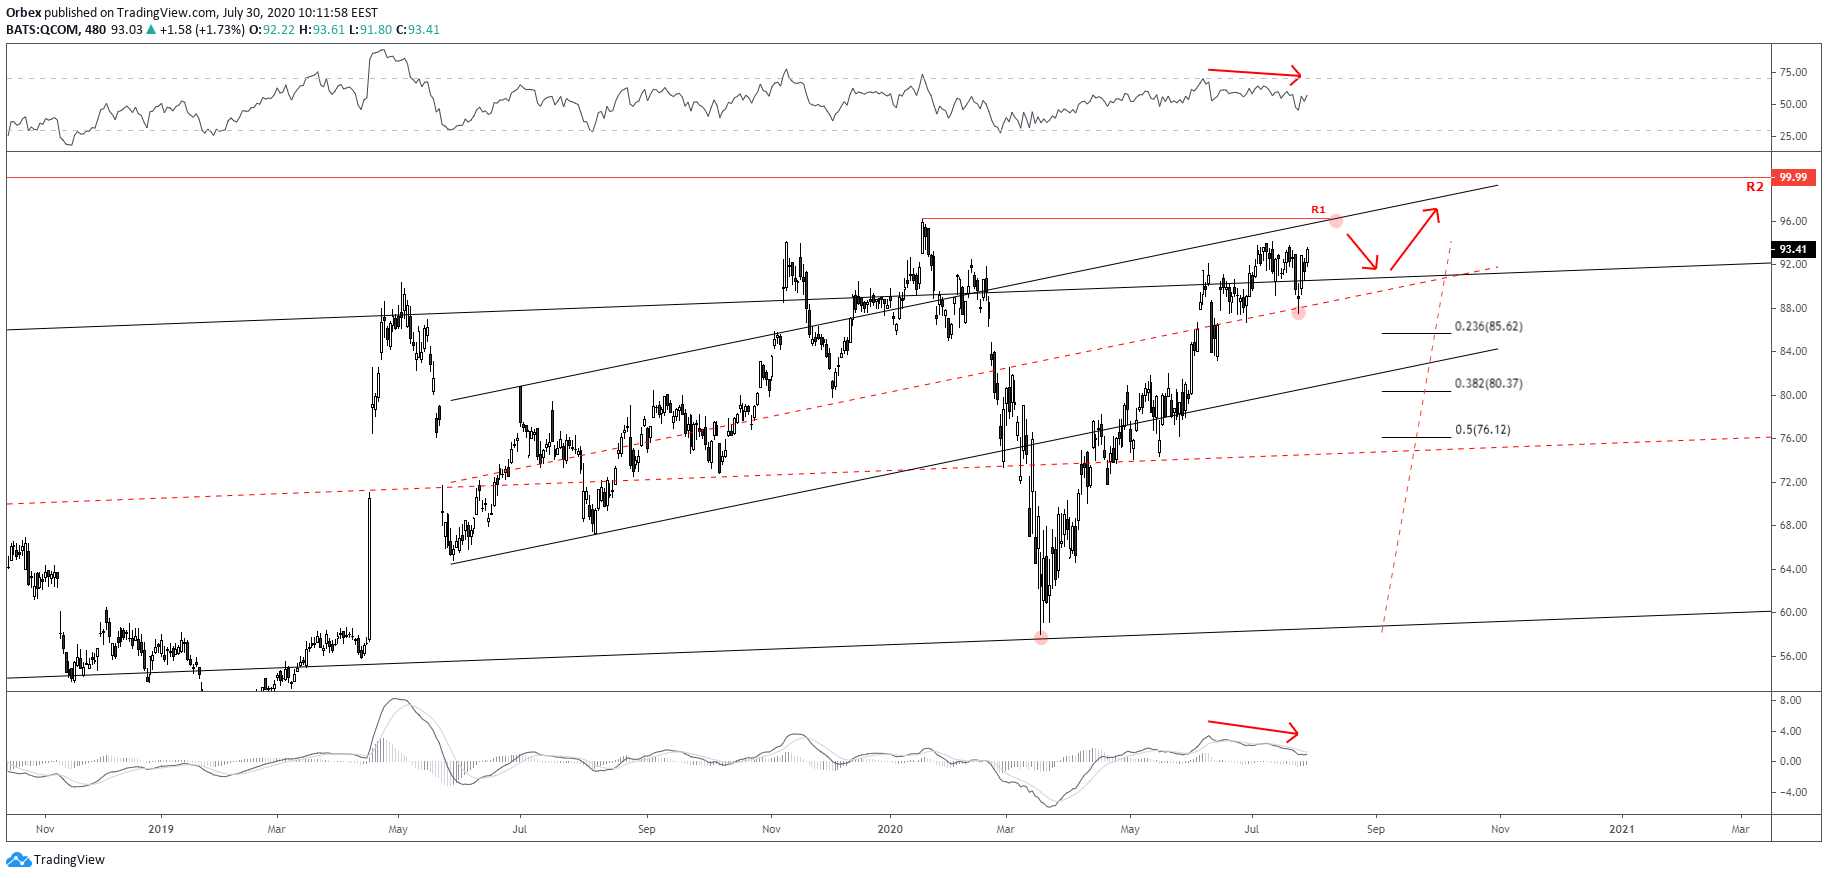
Should bullish momentum increase, prices will rise and chances of a double-top at $96.24 will increase. Such a move might form a hidden divergence, which when followed by the existing standard divergence, could offer a better bearish signal in the short-term.
If prices remain above the upper regression of the long-term channel, this scenario will be invalidated.
However, if prices break the regression support, then we could see the lower regression of the short-term channel offering an opportunity for a bounce. The bounce could be anywhere between the 38.2%-50% Fibonaccis between $76 and $80. Once completed, it could be then followed by a continuation to fresh all-time highs.

