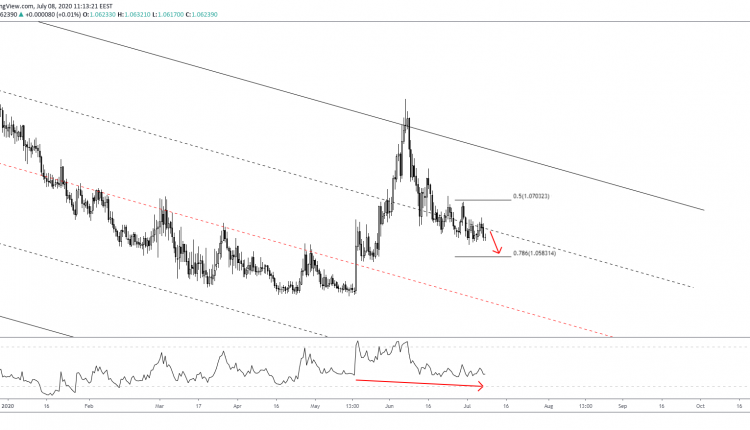
EURCHF sellers kept the pressure on since the 1.20 high on Apr ’18. The bearish trend has lasted over two years now.
We saw two suspected breaks beyond the regression channel on Apr ’19 and Jun ’20 -respectively. However, but both have failed. The latter attempt has formed a false break at 1.09, which is 50 pips higher towards the channel’s top.
This suggests that bulls are becoming more confident in the long term. Prices are trading below the median regression of the upper regression zone. However, they remain above the median regression (red) which is expected to increase bulls’ confidence going forward should it maintain its upward bias.
In addition, signs indicate that a bullish RSI (14) bias might be translating into a fruitful upside soon. However, this requires bulls to compromise some of their gains first.

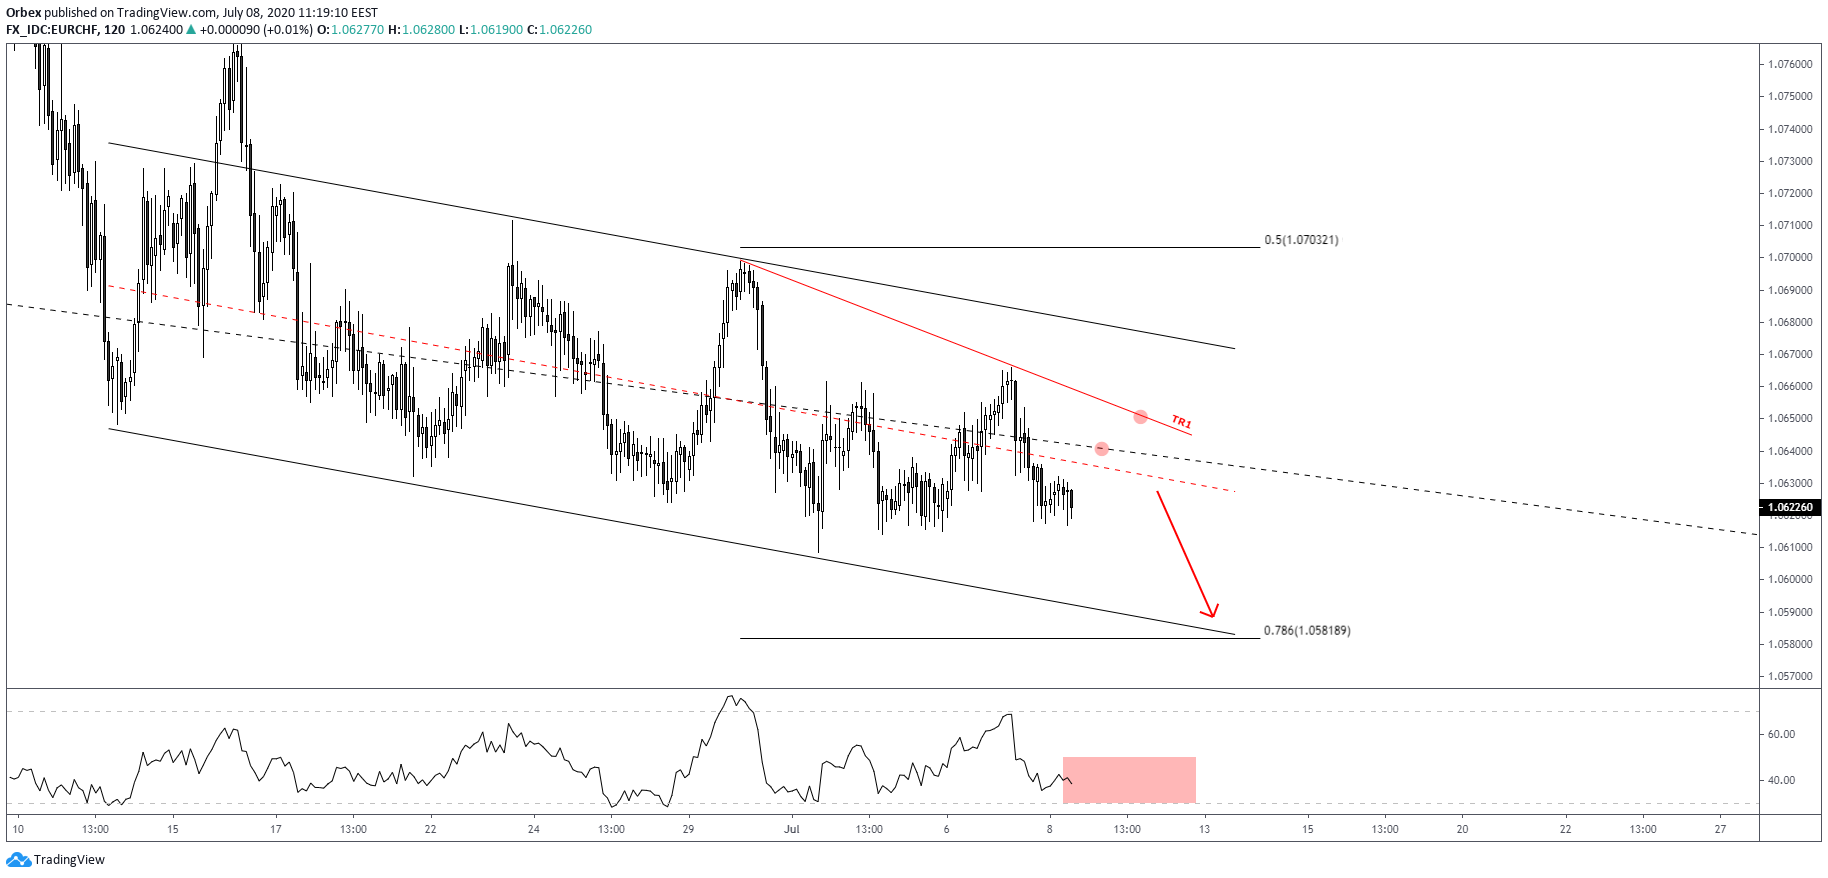
The above chart validates the pair’s bearish footing below the median regression of the short-term descending regression channel.
Despite no signs indicating a decline, having been on a bearish continuation for a while now suggests no change in the trend. At least until a fresh signal indicates otherwise.
A move down to the 78.6% Fibonacci retracement of the 1.05-1.09 leg will increase the chances of a bullish RSI (14) divergence forming. When combined with a rejection at the lower regression near 1.06 it will produce a strong confluence support level.
Prices could weaken following a rejection anywhere between the current levels and up to the TR1 resistance. Whereas a break of the said trendline will decrease the possibilities of a bounce at the Fibonacci retracement level, eying the upper regression and then the 50% Fibonacci.
Test your strategy on how the euro will fare with Orbex - Open your account now.

