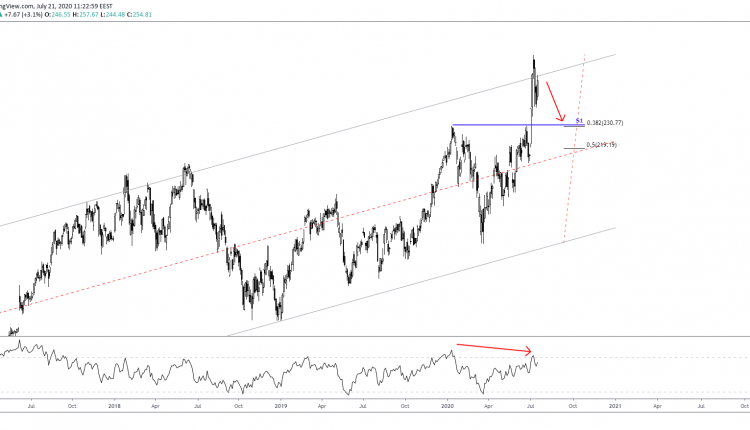
Alibaba (BABA) price soared to fresh all-time highs of $268 per share on July 09, following a break of the upper regression. The stock has been on an upward trend since the $120-$58 pullback that was recorded between Nov ’14 and Feb ’16 formed a long-term channel.
The multi-year channel breakout triggered a correction down to $240, registering a false break, initially. Pulling back within the regression channel hints at additional losses. This is also supported by the 2-day RSI (14) indicator as it has formed a bearish divergence against the price.
Trading near the upper regression after finding a base at the support low, the stock could turn negative again. The next medium-term base lays at the previous high of $230. This is in confluence with the 38.2% Fibonacci retracement of the $170-$268 leg, which makes firm support.
In addition, the said Fibonacci level might interact with the lower regression of the short-term ascending channel. This started forming after the $230-$170 pullback this year.

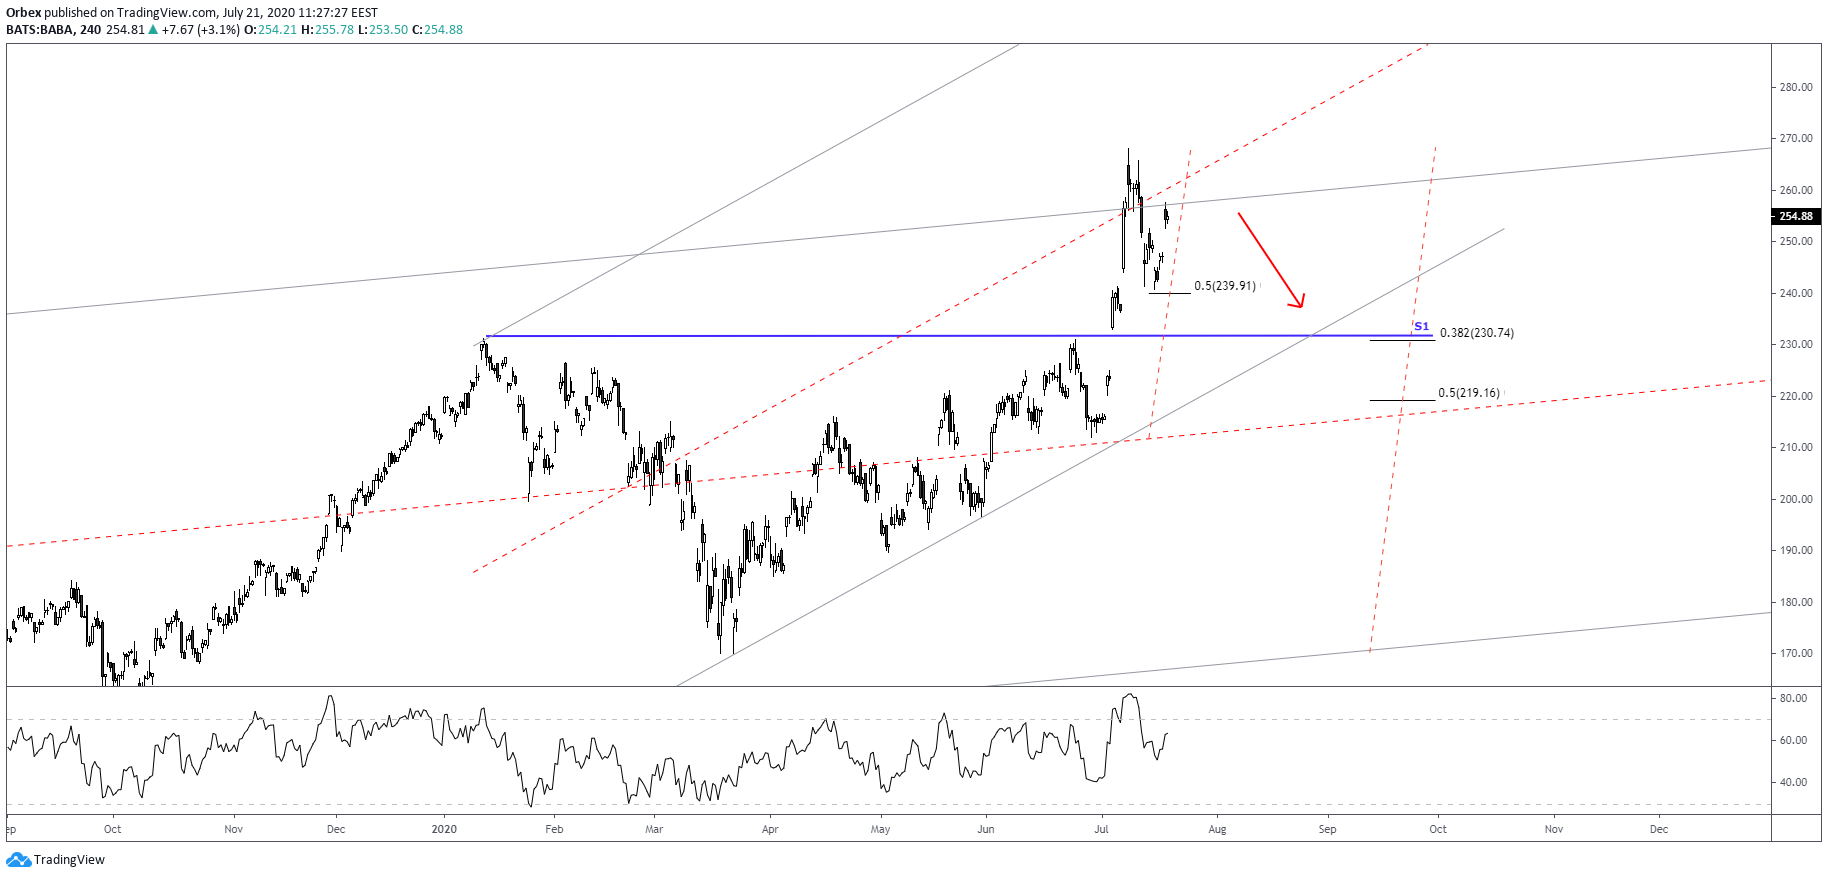
Despite the bullish short-term intraday sentiment, it came about after rejection as bears found support at the 50% Fibonacci retracement of the $211-$268 leg.
The positive short-term bias could be indicative of further depreciation. However, it requires price to remain below the all-time high of $268.
In addition, we prefer to receive signs of bearish divergence on the RSI (14). Currently, the short-term timeframe above shows no such signal.
We will expect the momentum to start showing signs of exhaustion to consider shorts towards the $230 and $220 supports.
Should the latter give in to bearish pressures, we will shift our focus on the lower regression below the $200 barrier. We do, however, remain bullish in the long-term following a valid test at medium-term lows.

