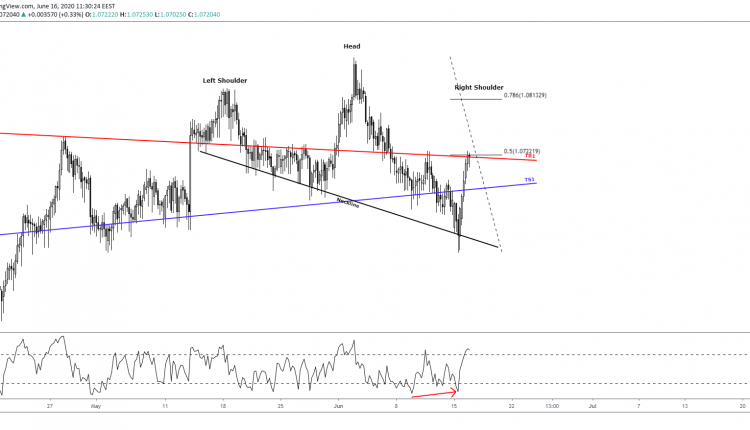
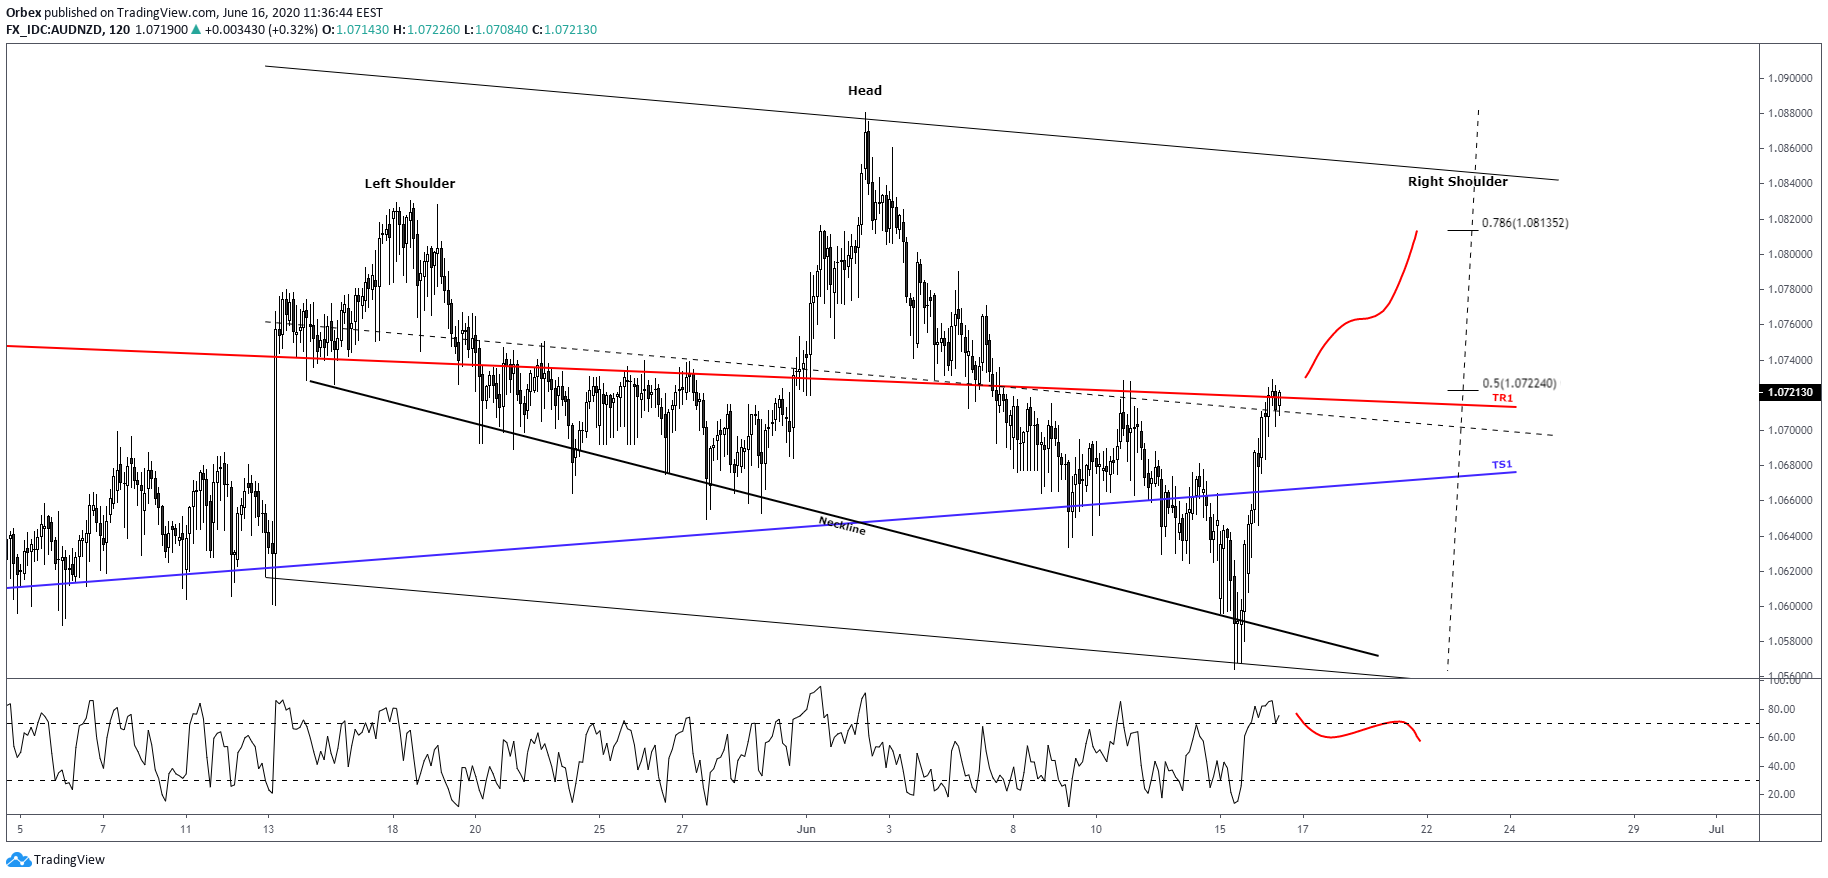
AUDNZD is struggling to get past the Aug ’18 trendline resistance TR1 near the 50% Fibonacci of the bearish leg down to 1.05, at 1.0722. However, the pair has broken the TR1 trendline twice over the past few weeks. This suggests that another bullish attempt could be underway.
The current structure on the 4H chart above resembles an upcoming Head & Shoulders pattern. With both the left shoulder and the head completed, a move towards the 78.6% Fibonacci of the 1.088-1.05 leg can be expected. This, however, requires a break of the 1.0722 resistance. That makes one think, is the current upside a bull trap?
Well, bulls could push prices higher with or without a correction. So, a correction could take the pair down to the trendline support TS1 – starting Jan ’19 nevertheless. In case the said level gives in to bearish pressures, then the next potential attempt could take place at the neckline.

Despite the fact that a deeper decline will decrease the chances of the H&S pattern completing, a bounce at the neckline can be expected. However, this will shift the pair’s bias to down, not up.
The break of the 50% Fibo, on the other hand, could take prices up to the upper channel. There, a rejection could be followed by a decline back towards the 1.0722. The chances of the pattern being completed successfully will increase too.
Note that the upper channel coincides with the 1.0813 Fibo region. This suggests that the chances of the right shoulder completing there are high.
If prices form the right shoulder while the RSI (5) forms a divergence then the chances of the pattern completing will increase.
Test your strategy on how the AUD will fare with Orbex - Open Your Account Now.

