Euro has been on a defensive stance across the board recently. Riskier assets, on the other hand, have been upbeat. This was led by the upside in WTI oil’s upside and by economies re-opening.
Will it last though? And if yes, how long for?
Although predicting that overall is impossible, we can start with the obvious.
We usually see the euro as a poor risk option, while we tend to consider commodity pairs as upbeat. There’s no question as to why the Aussie, Kiwi, and Loonie overperform a softer euro.

When we consider a medium-term perspective, however, Loonie dominates the current EURCAD market.
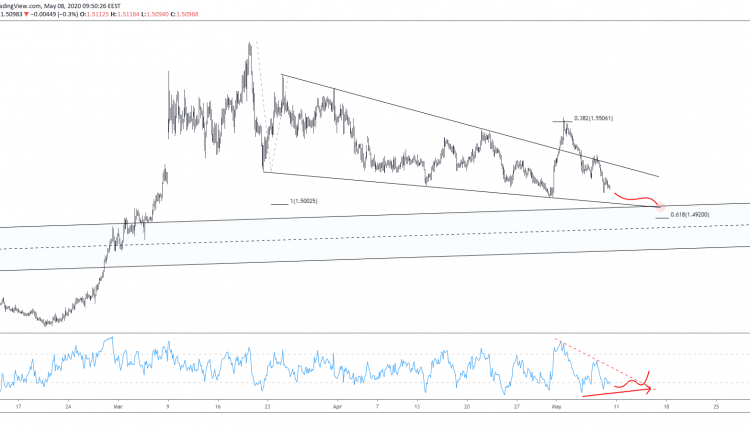
As shown in the featured chart above, euro bulls did make an attempt to break outside the multimonth descending triangle pattern. It failed, however, as the currency was sold off overall.
With risk increasing, the pair could slide lower, revisiting the bottom end of the triangle.
1.50 is not only an intersection between prices and the descending triangle. It’s also where the ascending channel starting Oct 1, 2019, meets prices.
In the short/medium-term, we expect EURCAD to take out the confluence level of 1.50. Big figures do attract both buyers and sellers as well. That said, the level is supported by the 100% Fibonacci expansion of the 1.5990 – 1.52 – 1.58 regions.
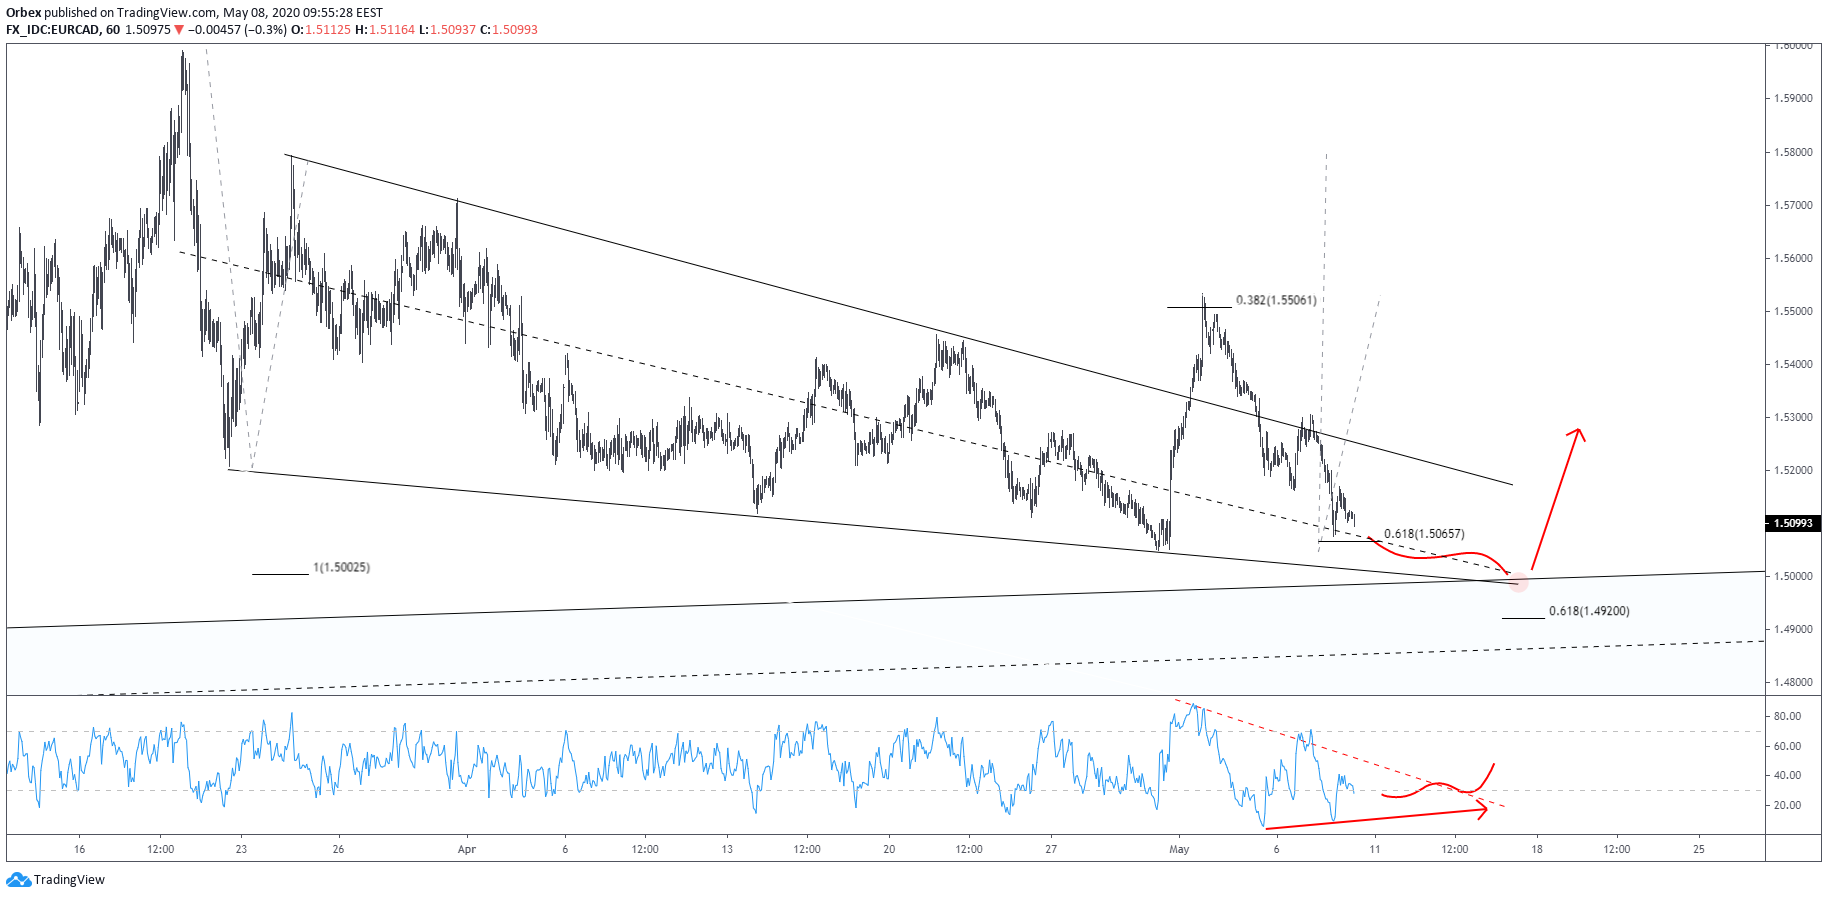
With EURCAD bulls rejected at the 38.2% Fibonacci retracement of the 1.5990 – 1.52 downside move, the chances of breaking to fresh lows below 1.5034 increase. A break of the 61.8% Fibonacci expansion at 1.5265 will support the narrative.
Looking at the corrective triangle, however, a false break outside the pattern will not be a surprise. At the end of the day, this will increase bullish bets as cheaper longs will be encouraged. It also is the 61.8% Fibonacci retracement of the 1.4260 – 1.5990 impulse, near 1.4920.
A move below the latter could take prices to the channel’s regression line, or even lower, below 1.48.


![Credit Card 160×600 [EN]](https://assets.iorbex.com/blog/wp-content/uploads/2023/06/13144507/Blog-Banner_EN-Banner_160X600X2.webp)