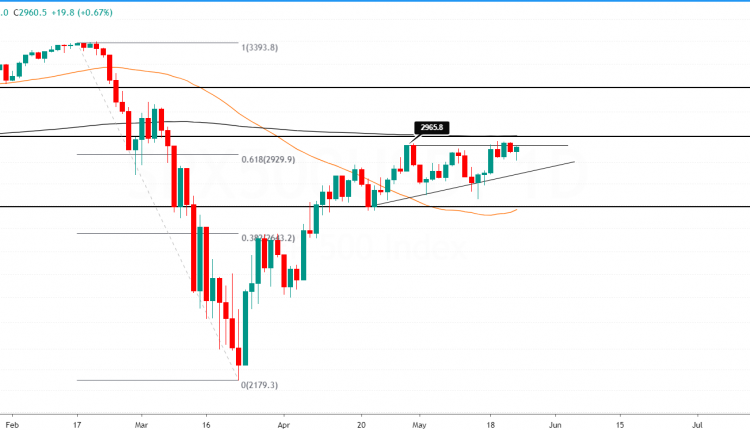
The S&P500 Index has been steadily rising higher. The correction to the declines in March is now past the 61.8% Fibonacci retracement level.
After forming an interim high near 2965, the index drifted lower, but not before re-testing this level again last week.
In the process, a minor resistance level is evolving near the 2965 level.
Combining this with the higher lows, price action is consolidating into an ascending triangle pattern. An upside breakout puts the minimum target toward 3198. But a failure in the upside breakout could see prices pull back to lower support at 2735.

The psychological 3000 level will be critical for this move.
The price area coincides with the 200-day moving average as well as becoming a key resistance level. Therefore, watch how the S&P500 reacts to this level. A successful breakout will put the index within reach to 3198.

