Two weeks ago, metals were posting new highs for this year. Gold was about to touch 1300, while Silver spiked all the way to 18.60.
We published an article, warning late buyers who were interested in buying those metals at their highest level of this year. In this article, we noted that traders need to be aware that a correction is highly possible after multiple weeks of gains and breakouts.
Since then, Gold and Silver has been declining gradually, losing more than 5% of this year’s gains. Gold declined all the way back to 1216, while Silver dropped back to $16, reaching our entire targets for that correction, mentioned in the previous reports.
Is The Correction Over Yet?

In terms of the technical analysis, there two ways to look at the recent declines. The negative point here is that both metals broke their daily uptrend line, which eases the bullish outlook for this year. However, the bullish outlook remains if both metals are trading above December’s lows, which stands at $15.60 for Silver and 1120 for Gold.
At the same time, Gold and Silver has been since yesterday right from a technical support level. Silver bounced back from November’s support area at 16.12, while Gold bounced off January’s resistance, which so far remains a solid support.
Therefore, the current bounce might be another correction before the downside pressure resumes. Or, this bounce might be a continuation of this year’s bullish trend. However, both metals are required to prove their bullishness by rebounding above the broken uptrend.
Where Do We Go From Here?
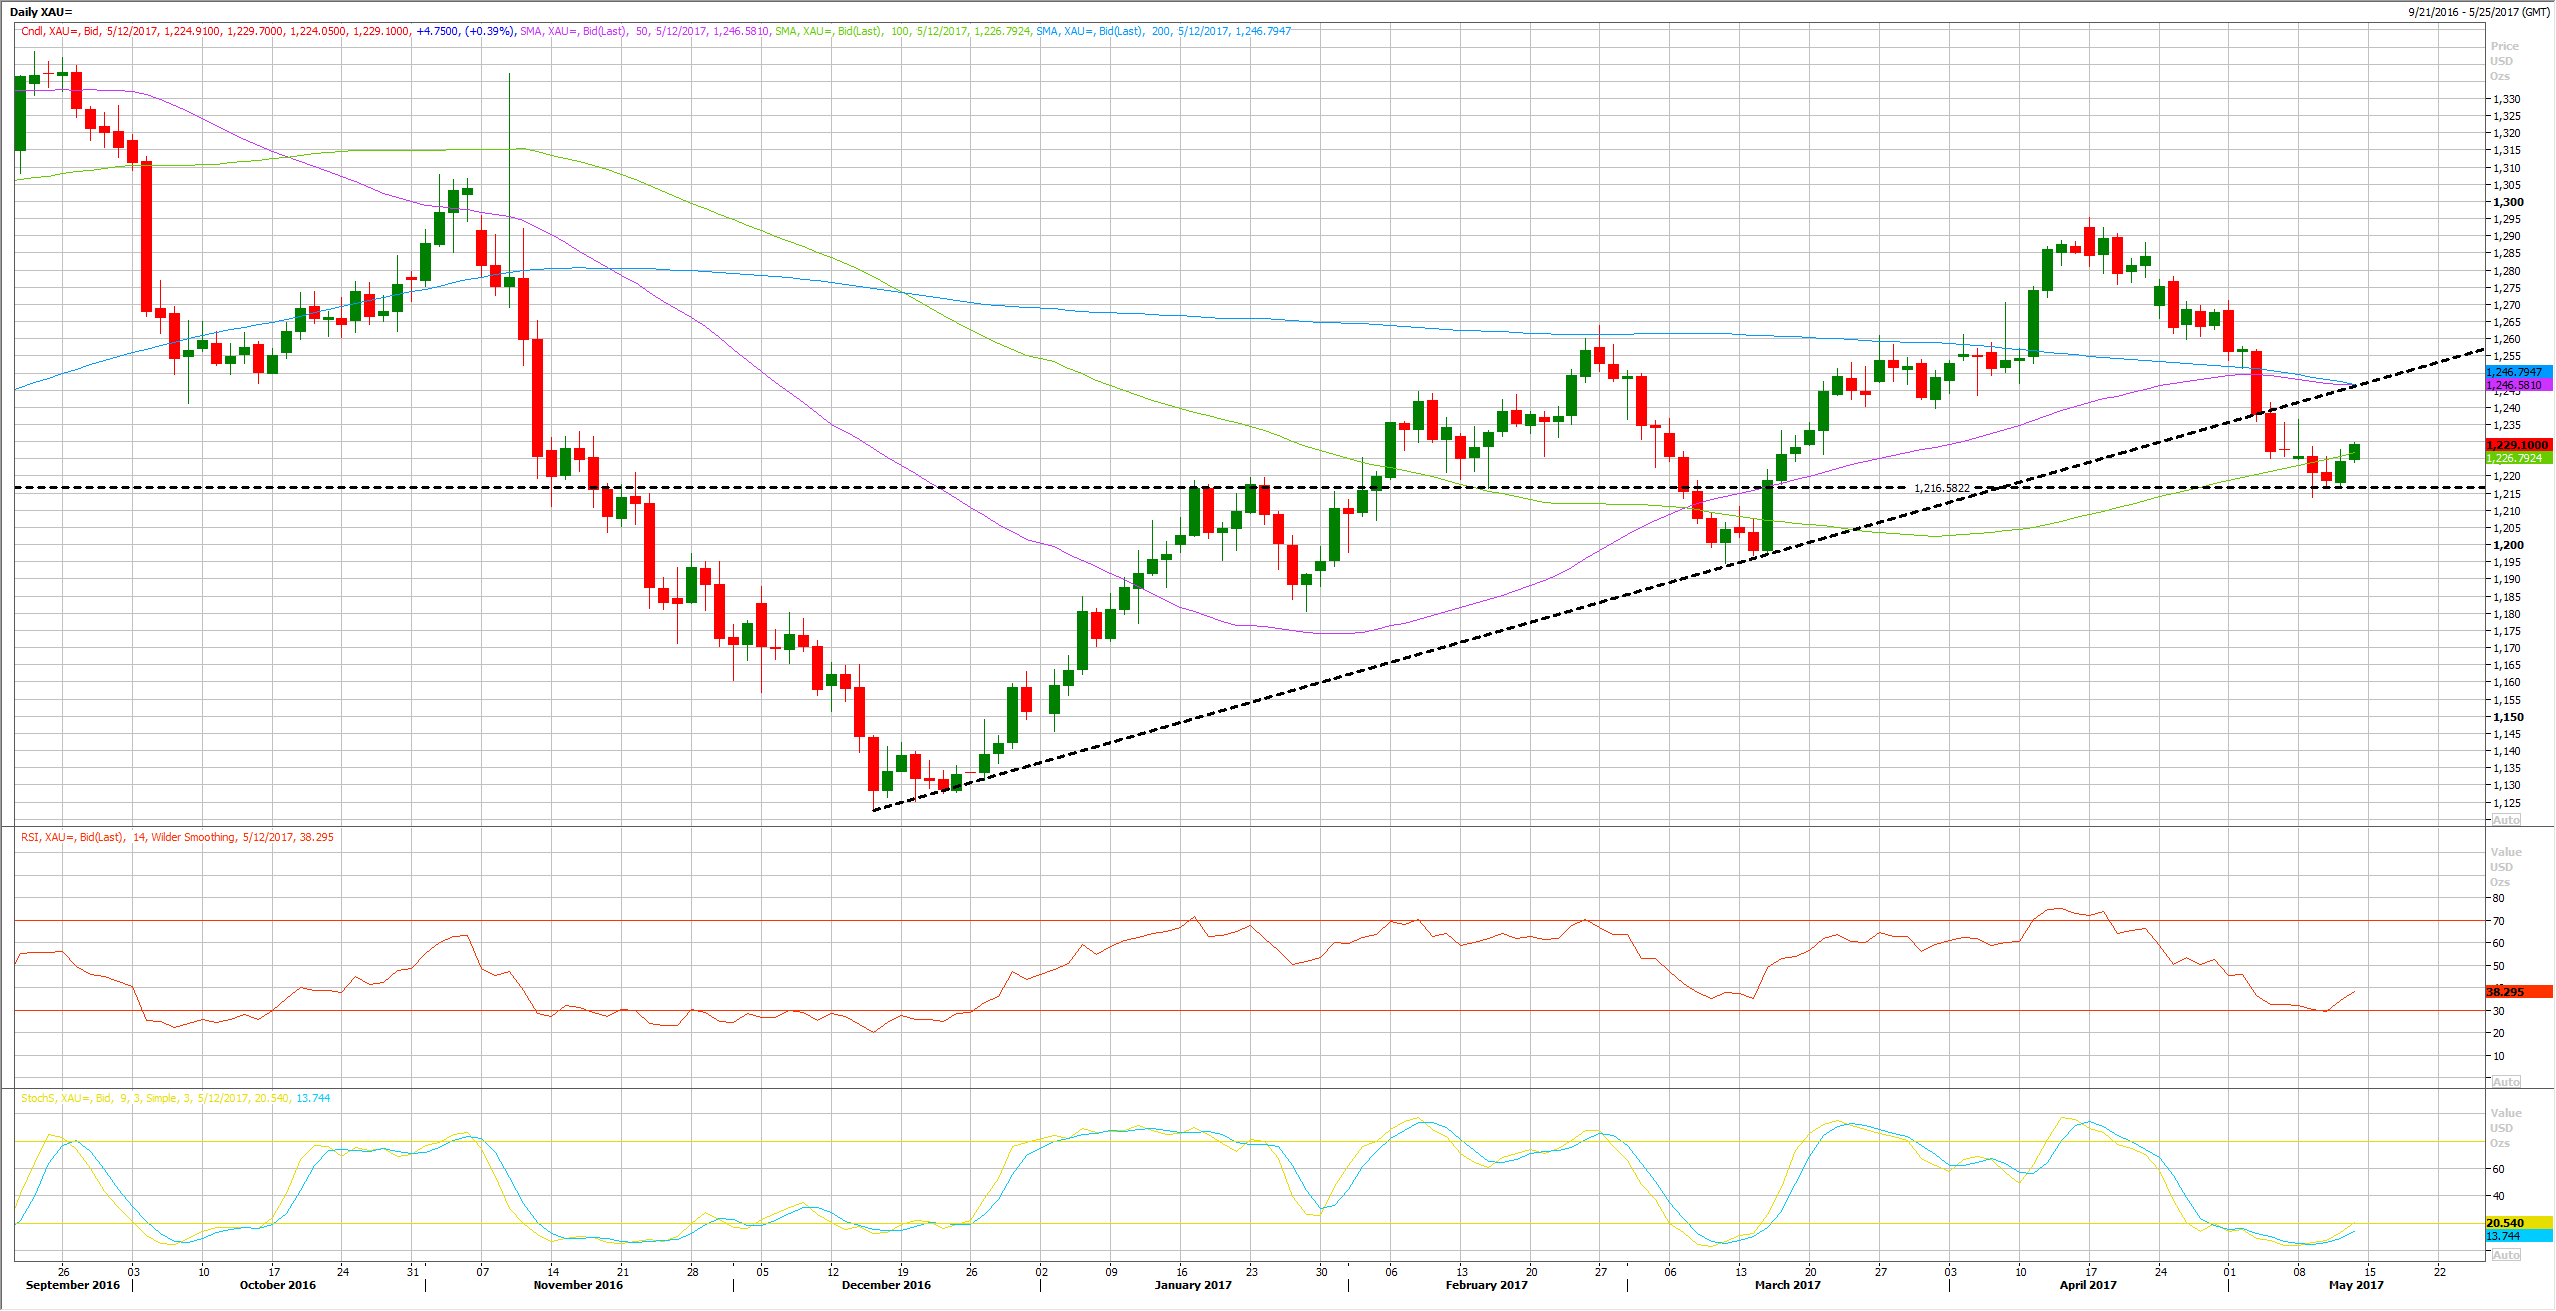
Looking at the Gold technical daily chart, it’s trading above its 100 DAY MA which is a bullish sign, but we need a clear weekly close above that resistance, which stands at 1226.
At the same time, Gold remains above March’s bottom around $1195, which keeps the possibility that the recent dip was another short-term retracement, despite the fact that the trend line is broken.
Moreover, the technical indicators are heavily oversold and crossed over to the upside, which supports the idea of another spike higher over the coming days/weeks.
The most important level to keep an eye on in the coming days/weeks stands at $1246. This level represents the broken up trendline, the 200 DAY MA and 50 DAY MA. All those technical levels stand at the same area.
A break above that area is needed to renew the strongly bullish outlook for this year. Otherwise, another selling pressure would be more likely.
Silver Needs To Stay Above 15.50
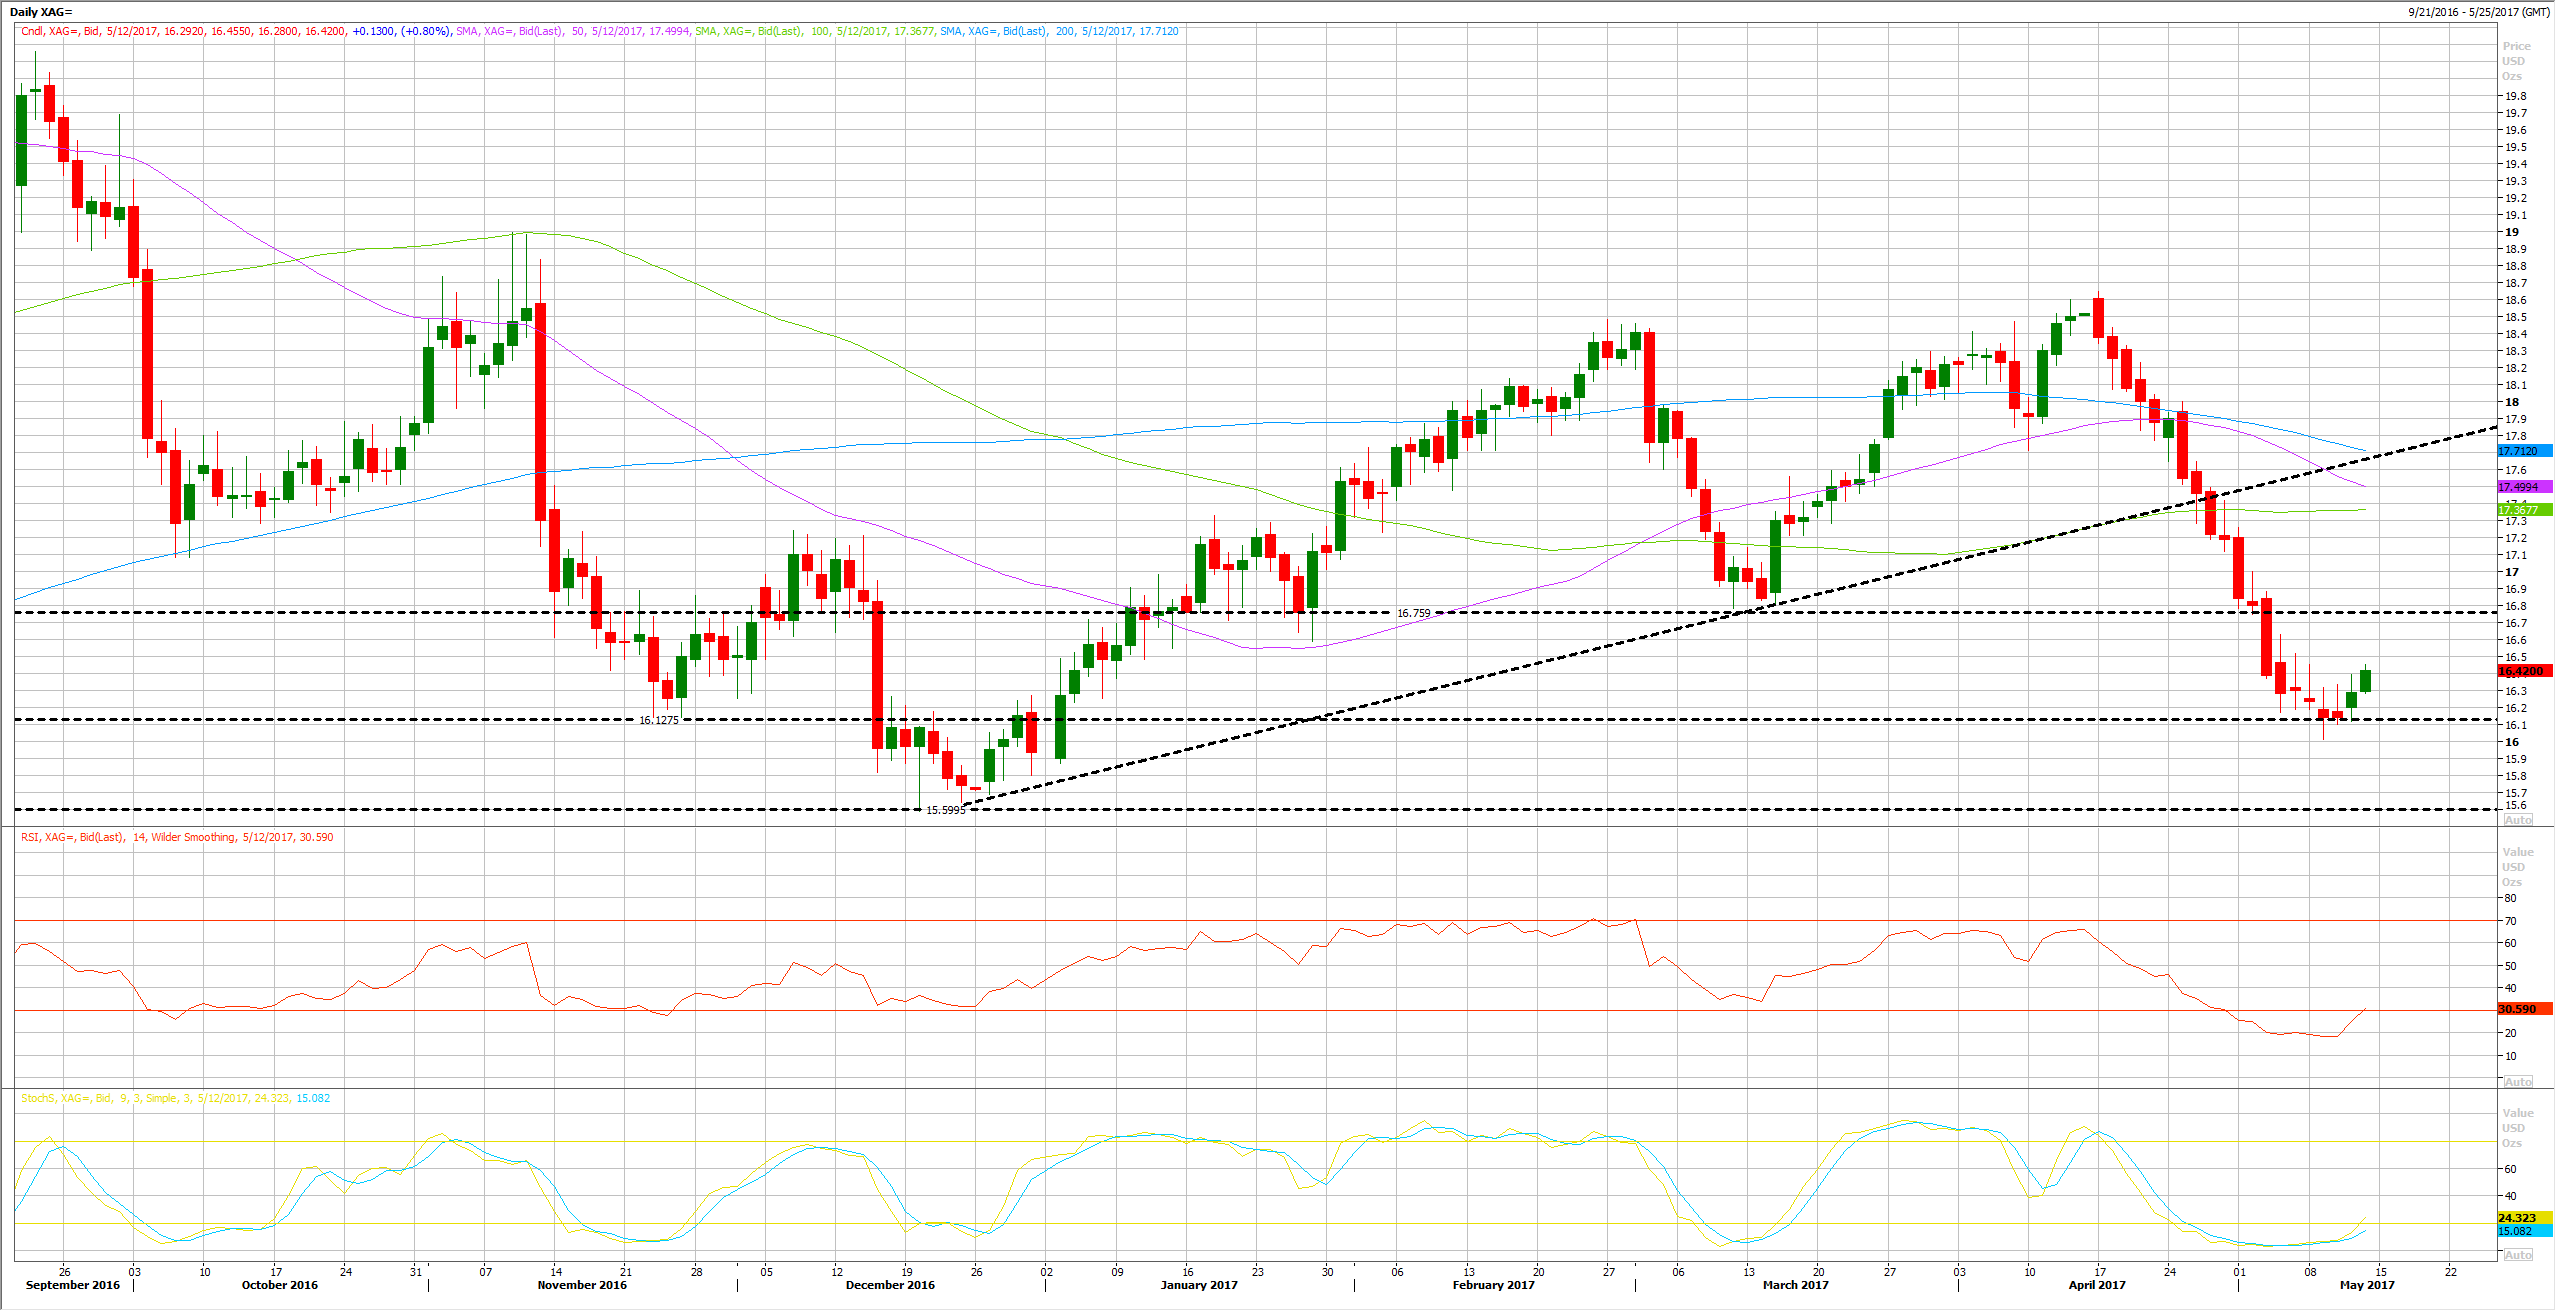
Silver chart has a little bit of different story. Silver outperformed gold during the recent declines, posting the longest daily decline since years.
However, bouncing off November’s lows would ease the bearish pressure for some time. However, Silver also needs to prove itself by posting more aggressive gains.
Yet, the first resistance area that Silver needs to rebound above it stands at 16.75, which is March’s lows. A failure to do so would put Silver at risk to renew its selling pressure. However, the technical indicators are heavily oversold and crossed over to the upside, which keeps the bullish outlook for the next few days.
A break above 16.75, would clear the way for another bounce, probably toward its 100 DAY MA which stands at 17.30’s. But the most important level that Silver needs to break above and close a week above is resistance – 17.70’s, where the broken trend stands now.
If so, this would renew the bullish outlook for the current year, and Silver would be read to break this year’s high once again above 18.70’s.

