
Yesterday, Crude Oil prices advanced and closed the day higher, posting the highest level since the beginning of this month.
The rally, of course, is supported by a lot of remarks by many of oil producers (OPEC and Non-OPEC) regarding the highly possible deal, which should be announced later today.
According to the latest news, there is a possibility to extend the output cut deal for 9 to 12 months instead of 6 months.
Crude Tumbles Today

Despite all the talks about a possible deal to extend the agreement for more than six months, Crude prices tumbled by almost 2% after they were higher by around 1% during the Asian session.
Brent declined all the way back from its intraday high at 54.60 to as low as 53.30, while WTI Crude fell off a cliff from 51.97 session high to 50.30 session low.
There is no big reason for such decline so far, the only headline that might have a negative effect is that Iraq Oil exports with Kurdistan are 3.92M barrels per day.
Yet, this is not enough for Crude to decline that much in a very short period of time. The coming hours will give us more clues and more info.
What To Expect Today?
Once again, we would like to remind traders that most of the extension deal is priced in. The extension talks have been on the market for more than six months now.
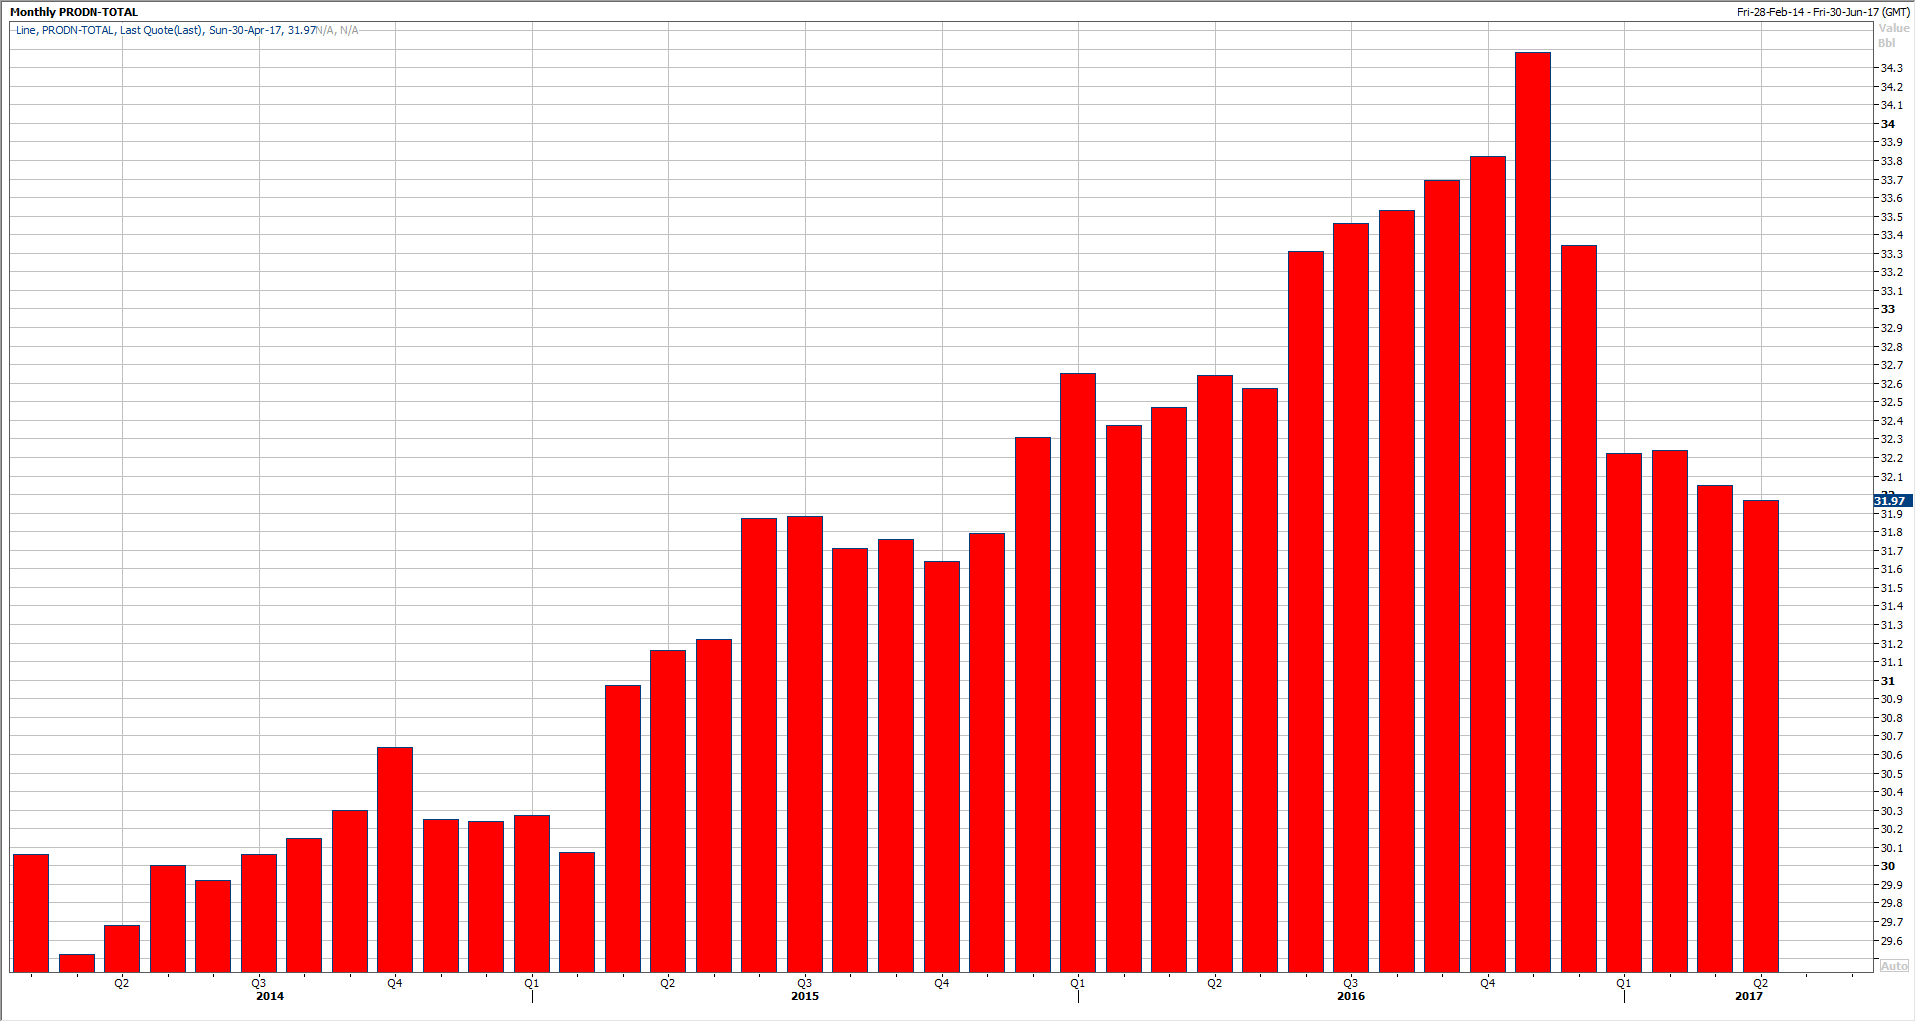
Since the beginning of the year, Crude prices failed to hold any gains despite the output cut in December, leading to lower highs formation on the weekly chart.
Such move since the beginning of the year gives us a sense that the prices need more actions than just an extension.
Meaning, Crude prices need more cuts in output in order to rally above this year’s high. Otherwise, the downside pressure is more likely.
Therefore, today’s announcement might have a short-lived positive impact on Crude prices, before the downside pressure resumes.
Brent Technical Outlook
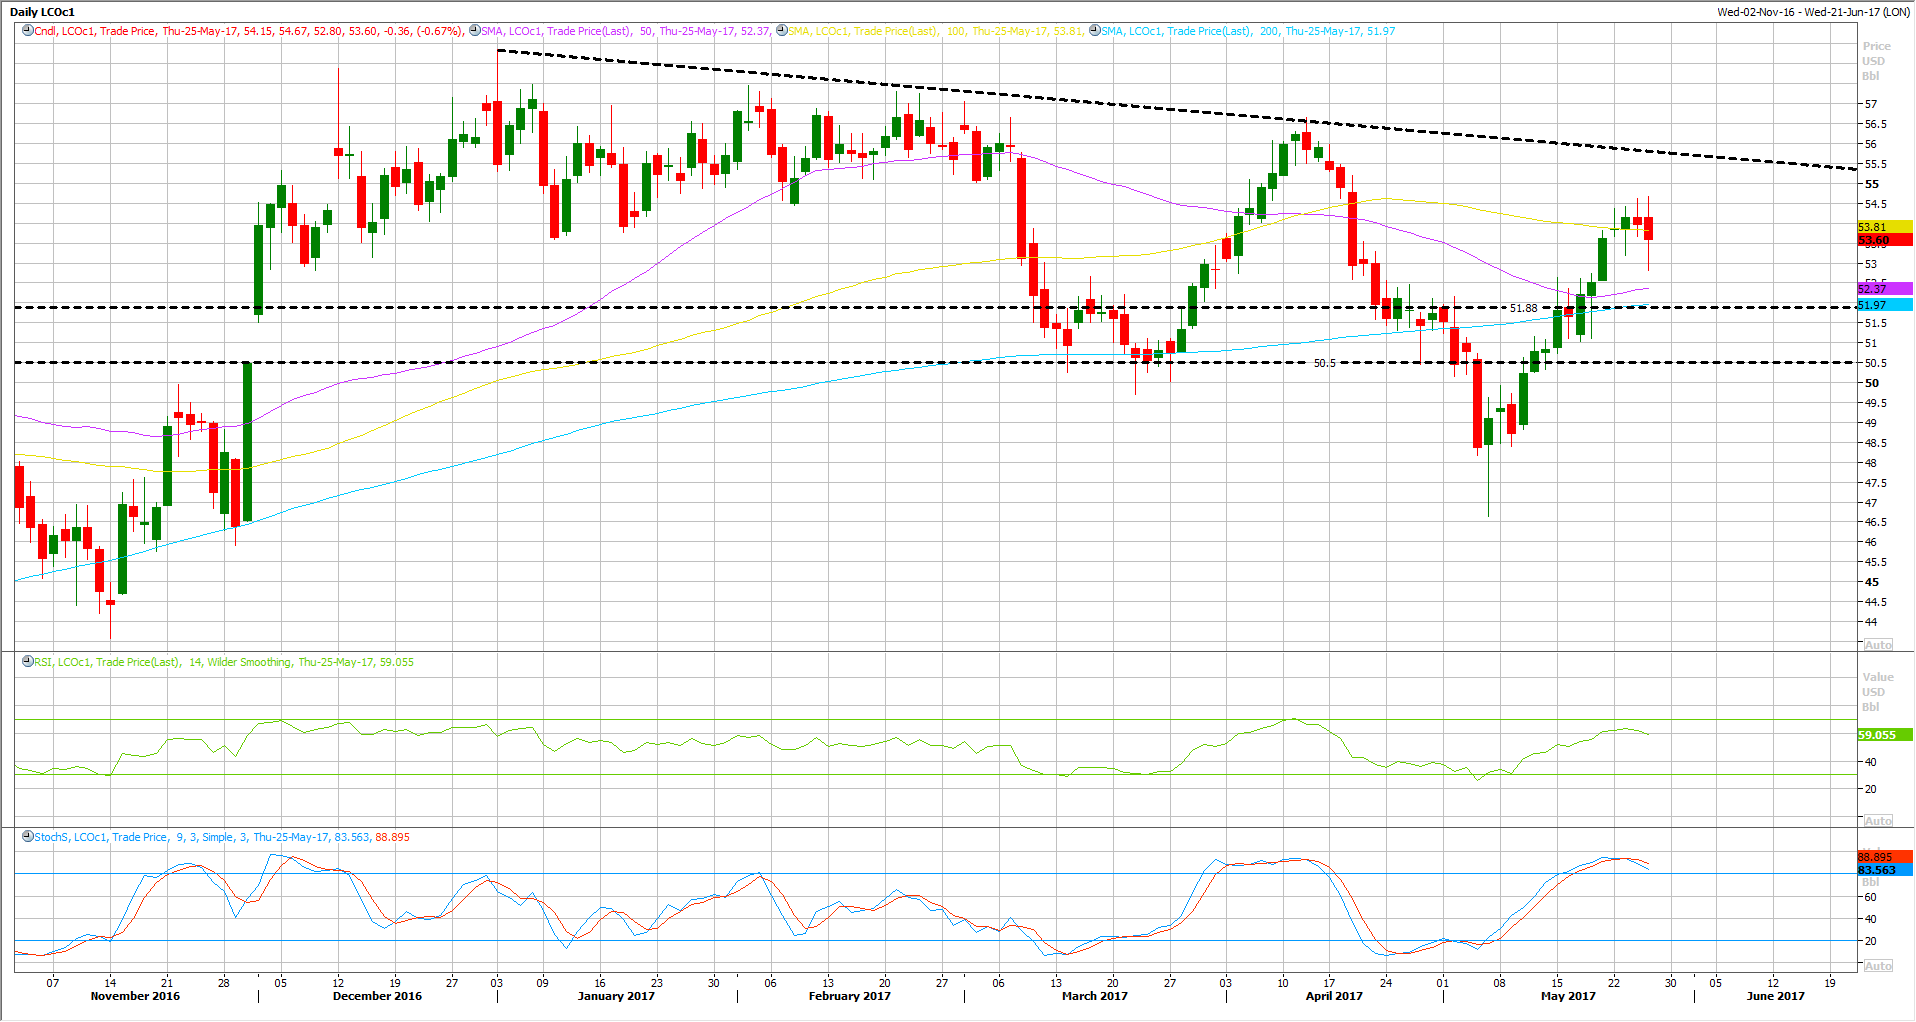
Looking at the daily chart above, Brent managed to recover for the past two weeks above its entire Moving Averages, including the 50, 100 and 200 DAY MA’s.
However, the technical indicators are heavily overbought and crossed over to the downside during yesterday’s trading, which eases the chances for another spike higher.
Moreover, the lower highs pattern on the daily chart remains as long as Brent continues to trade below the previous top which was seen in April at around 56.65.
On the downside view, the first immediate support stands at 52.30 which represents its 50 DAY MA followed by $52, which represents its 200 DAY MA and a former support ahead at the same time.
WTI Technical Outlook
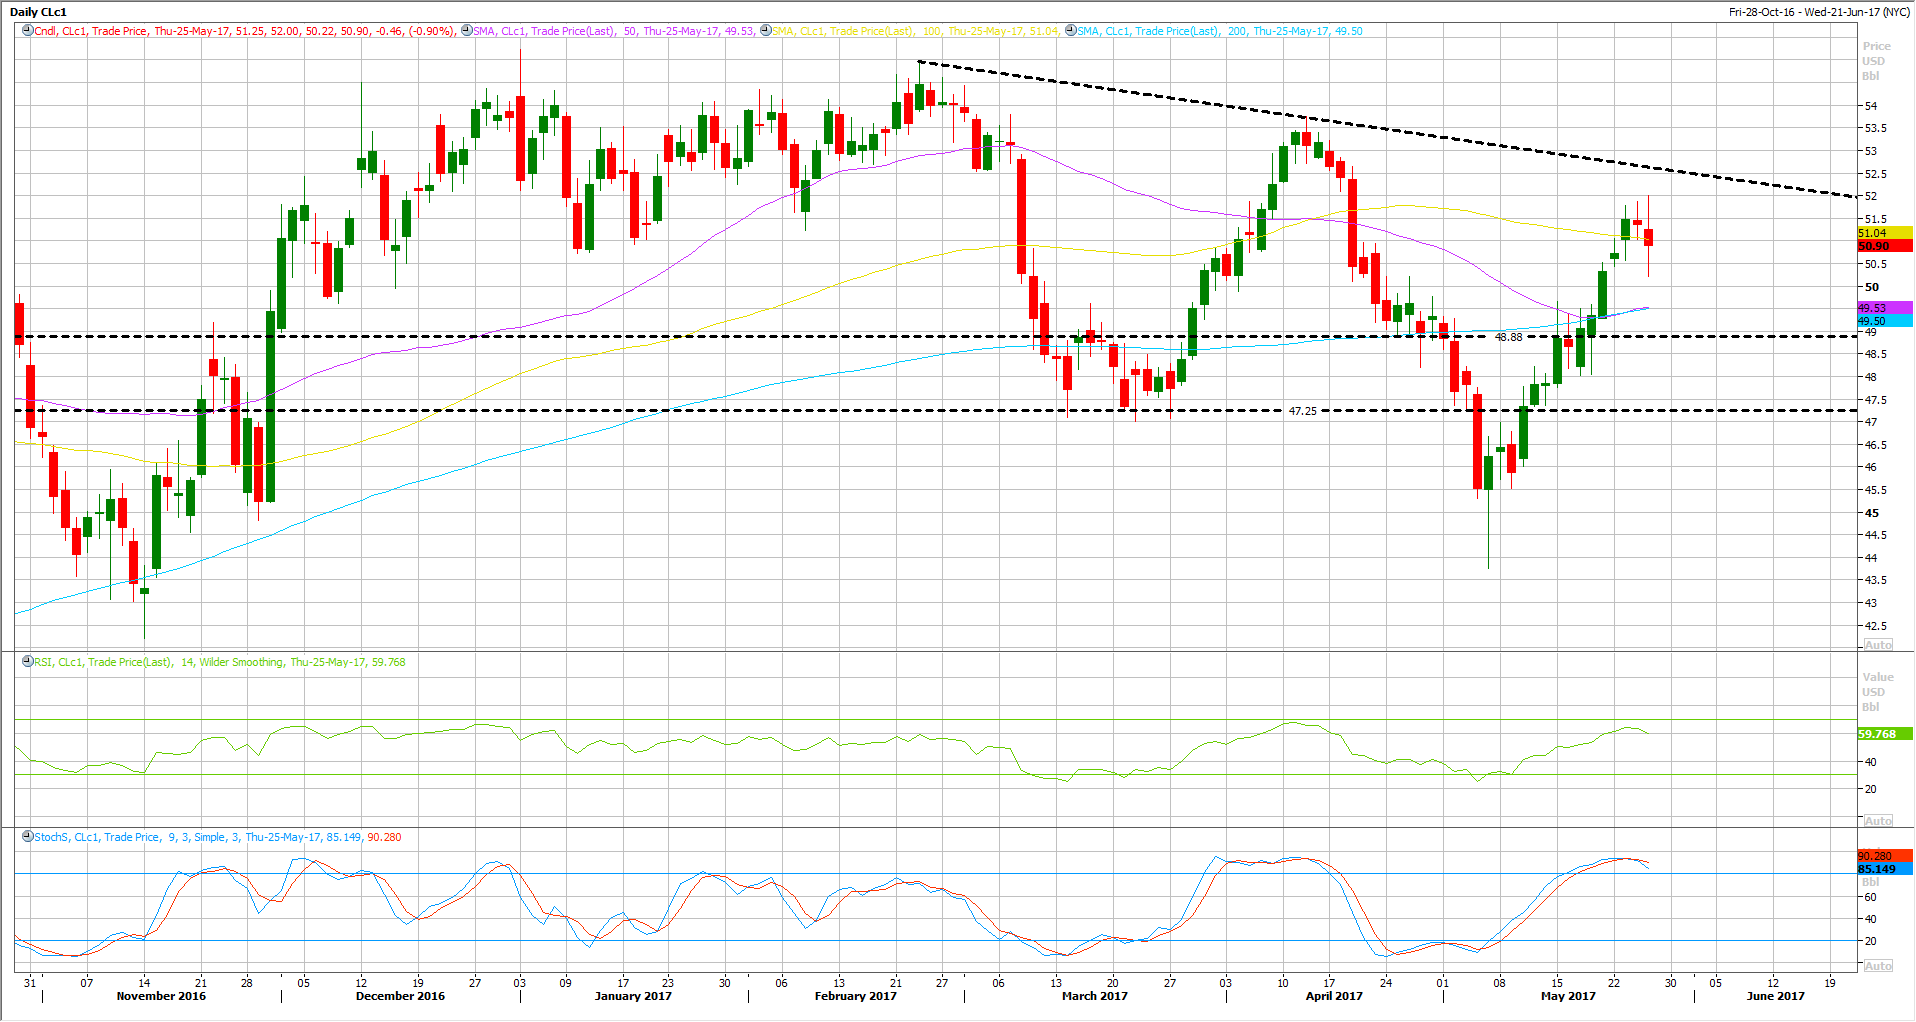
The same story applies to WTI Crude. WTI spiked all the way above its entire Moving Averages, but still struggling below $52 mark.
The technical indicators are heavily overbought on most time frames, especially the daily chart, which eases the chances for a possible bull run ahead.
WTI Crude also has a lower highs pattern on the chart above, which means that the bearish outlook is here to stay as long as WTI continues to trade below April’s highs around 53.80.
On the downside view, the first immediate support stands at 50 which represents the psychological support, followed by 49.50 – 50 and 200 DAY MA.

