
If you have read our previous report on equities, you would notice that most of the indices that we mentioned did move according to our plan.
Most of the global equities continued to retrace to the downside. The retracement comes just right before the earnings season. However, the geopolitical tension played the biggest role in such move.
After the recent decline in S&P500, FTSE100, and Nikkei 225, another move could be underway. We will take a look at these three indices and mention what traders should be looking at for the next few days/weeks.
S&P500 Below 50 DAY MA

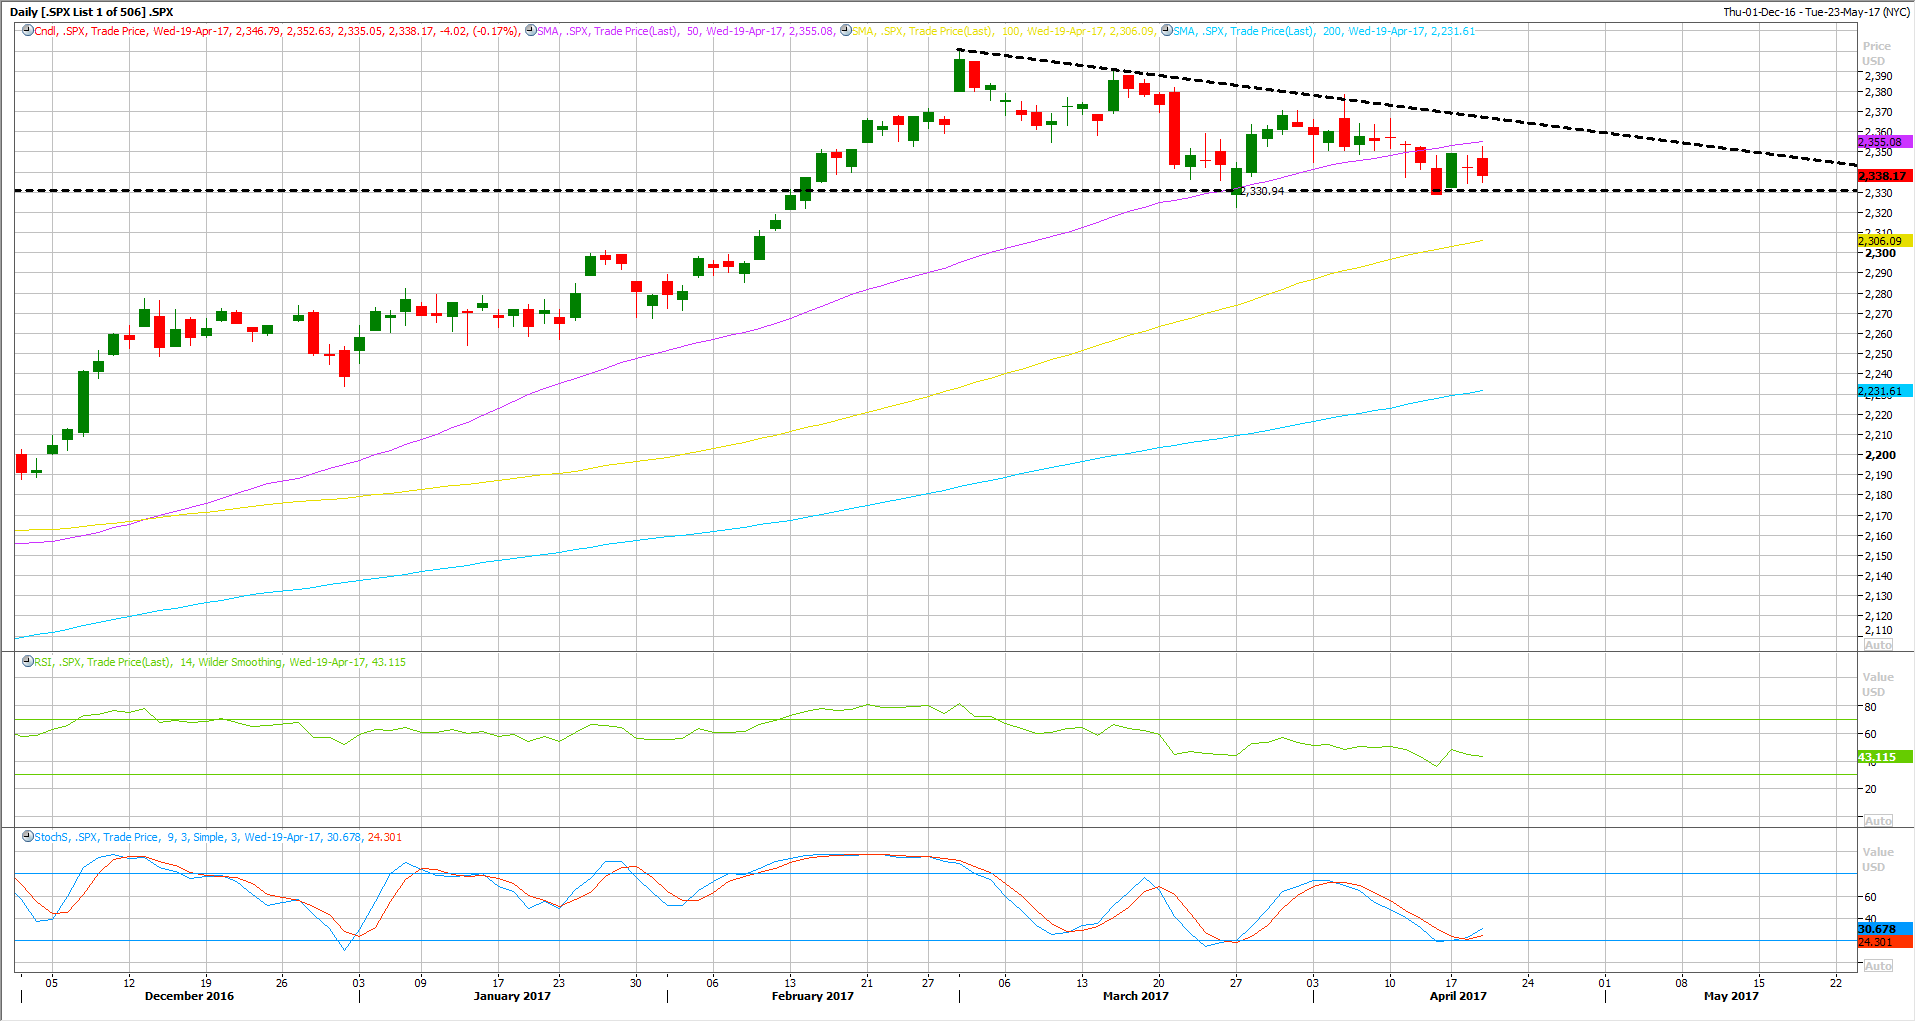
The S&P500 continued to decline further for the past two weeks, breaking below its 50 DAY MA for the first time since November of last year.
The index is trading below that MA for the past five sessions, which deepen the short-term bearish outlook.
Yet, traders should be very careful as the technical indicators are oversold and moved slightly higher; the RSI remained below the 50 Mid-point.
In the meantime, the resistance area stands at 2355, which represents the broken 50 DAY MA. A retest of that MA is possible before the downside pressure resumes.
On the downside view, the first immediate support stands at the recent lows at 2330, which should be watched very carefully, as a breakthrough that support would clear the way for further declines, probably toward 2306, which represents the 100 DAY MA.
The bearish outlook invalidation signal would be a clear break above the short-term downtrend line shown on the chart at 2367, with a daily close above that resistance.
If so, the index would probably be ready for another bull run to a new record high.
FTSE100 Tumbles After Election Announcement
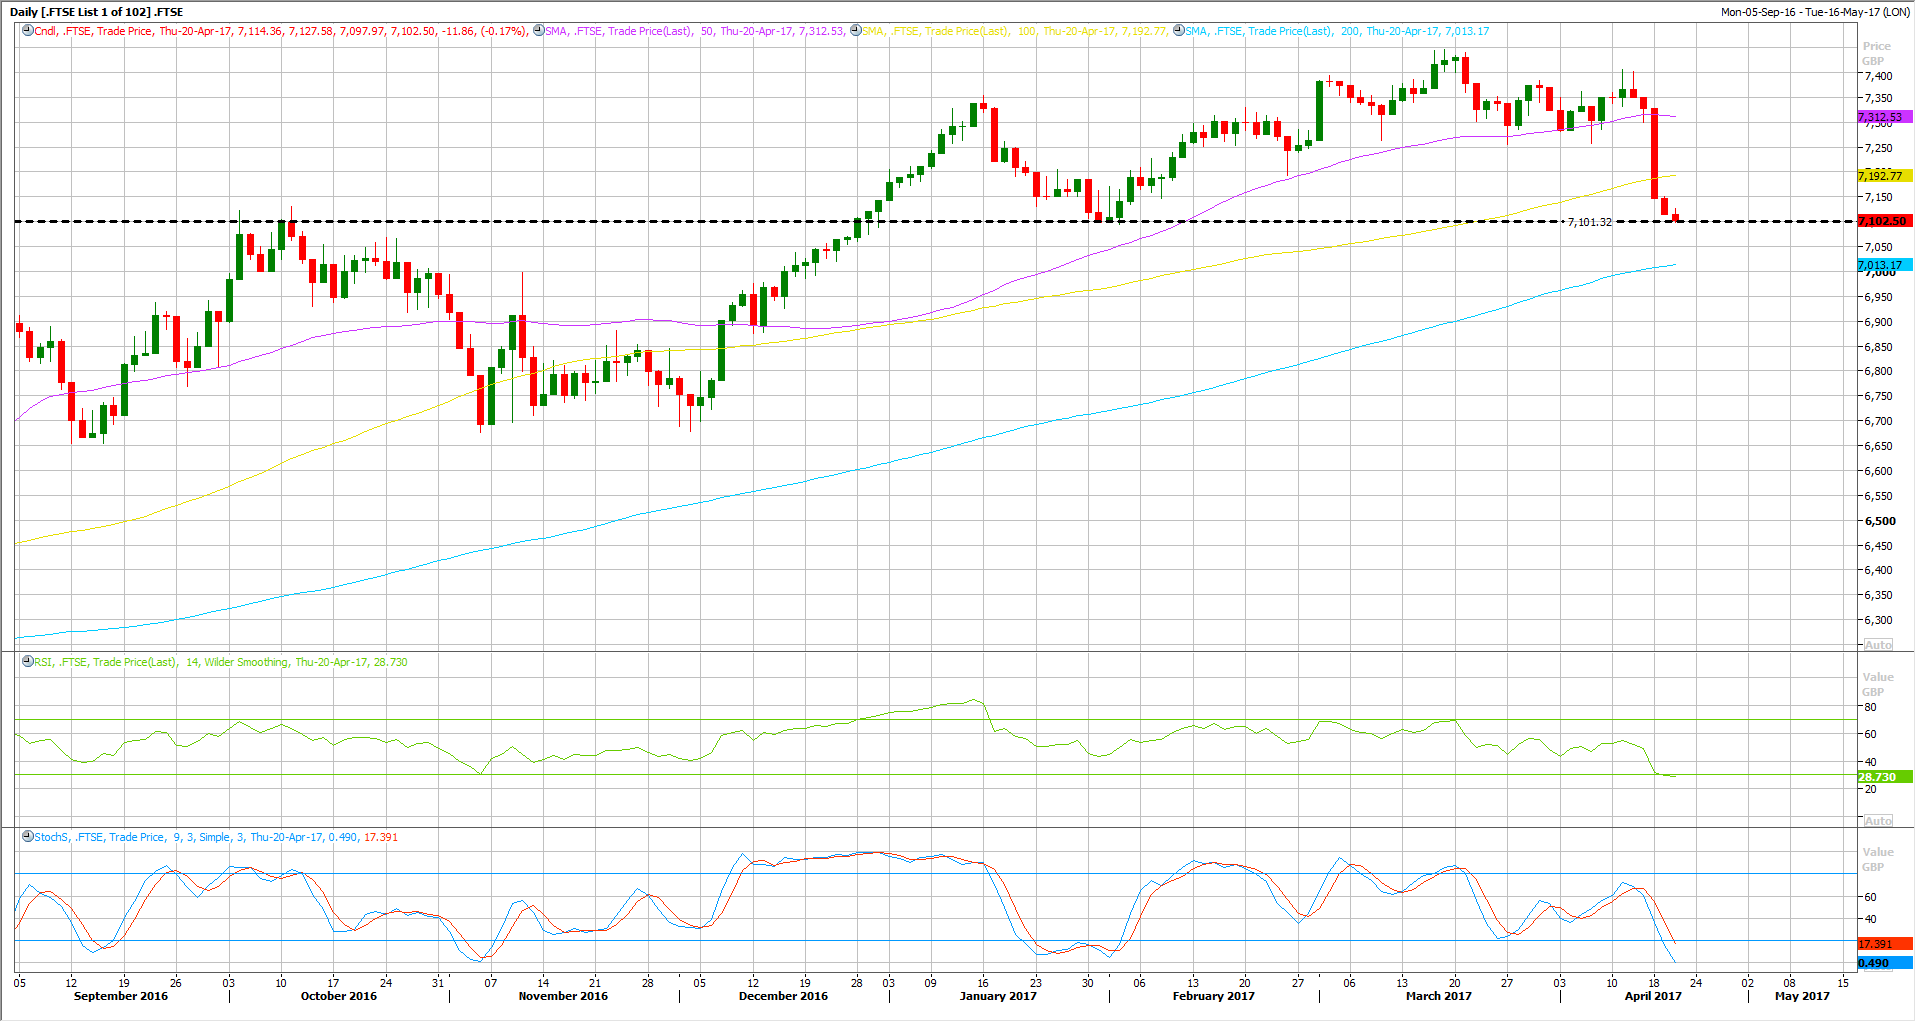
At the beginning of the week, there were some technical signs of a downward retracement on FTSE100. The index was trading above its 50 DAY MA, tried to a breakthrough that support but without any chance.
The needed catalyst came in from the UK PM, who announced a general election on June 8th, which sparked a notable selling pressure.
The FTSE 100 broke through its 50 and 100 DAY MA, posting the fifth consecutive days of declines, which is the longest declining stake since October of last year.
In the meantime, the index is trading at a key support which stands at 7100, which should be watched very carefully today, as a breakthrough that support, would spark another selling pressure, probably to test its 200 DAY MA which stands at 7013.
Nikkei 225 Bearish Outlook Deepens
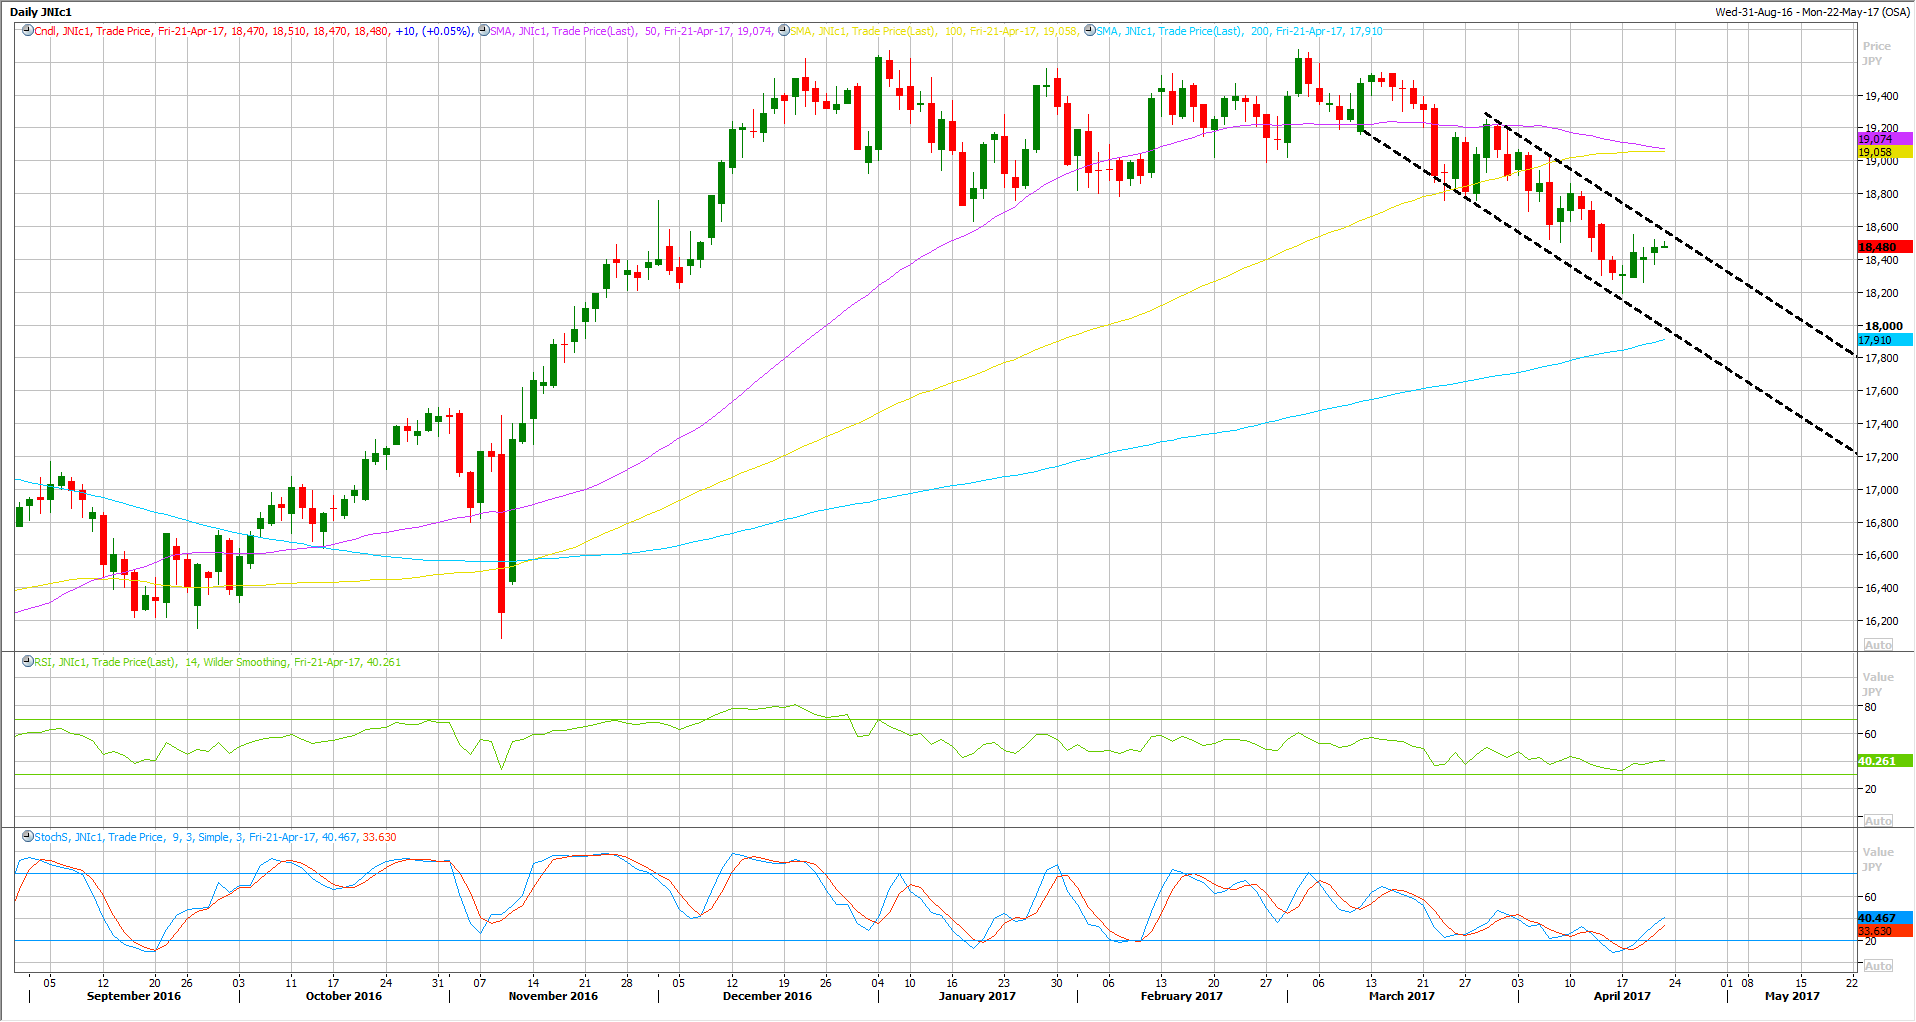
The Nikkei 225 declined further according to our previous plan; the index broke through its 50 and 100 DAY MA as shown on the chart.
The decline continued all the way to 18200, where buyers appeared, sending the index back to 18490 earlier this morning.
However, the bearish outlook has deepened further, especially as the 50 DAY MA is crossing below the 100 DAY MA
In the meantime, the index is trading within a clear down trend channel as shown on the chart. The upper band of the channel stands around 18550, which likely to hold. Sellers are likely to appear once again around that level.
Another decline is highly possible to retest this week’s lows at 18200, while a breakthrough that support would clear the way for further declines to 18000.
The invalidation of such move would be a clear break above the upper band of the channel with a clear one day close above that resistance. If so, the Index would extend its rally above 18600.

![Credit Card 160×600 [EN]](https://assets.iorbex.com/blog/wp-content/uploads/2023/06/13144507/Blog-Banner_EN-Banner_160X600X2.webp)