
Since the announcement of the OPEC deal in December, there are no doubts that Crude Oil prices have stabilized, including Brent Crude and WTI Crude.
However, since the beginning of the year, the prices have been trading within a tight range and stuck below key technical levels. In today’s article, we will take a look at these levels, why the prices are unable to break higher and what to expect in the coming weeks.
Is OPEC Deal Still Valid?
Despite the agreement between OPEC and Non-OPEC members, there were some headlines over the past few weeks, which raised some doubts over the ability to cut the production as planned. Some of the countries like Libya, Iran and Iraq increased their production to a record in December.

Yet, This doesn’t mean that they breached the deal with OPEC since the deal is effective in January. However, Iraq noted that it would provide full oil supplies to two refineries in Asia until February, which might be a sign that OPEC might not cut the production as planned. However, only time will prove. Traders need to keep an eye on January’s production data when they are announced.
US Crude Oil Inventories Rises Last Week
Yesterday, the US Crude Oil inventories came in with a notable surprise, showing a surplus of 4.1M barrel last week, despite the fact that the estimates were to show a surplus of 0.9M barrels only, posting the biggest weekly increase since Mid-November.
Some would ask, how the inventories rise while production is set to decline. Well, shale oil refineries might be the reason, since Crude is trading above $55, this would be a reasonable price for them to start pumping again. This is another threat to OPEC deal as well.
Brent Is Stuck Below $56
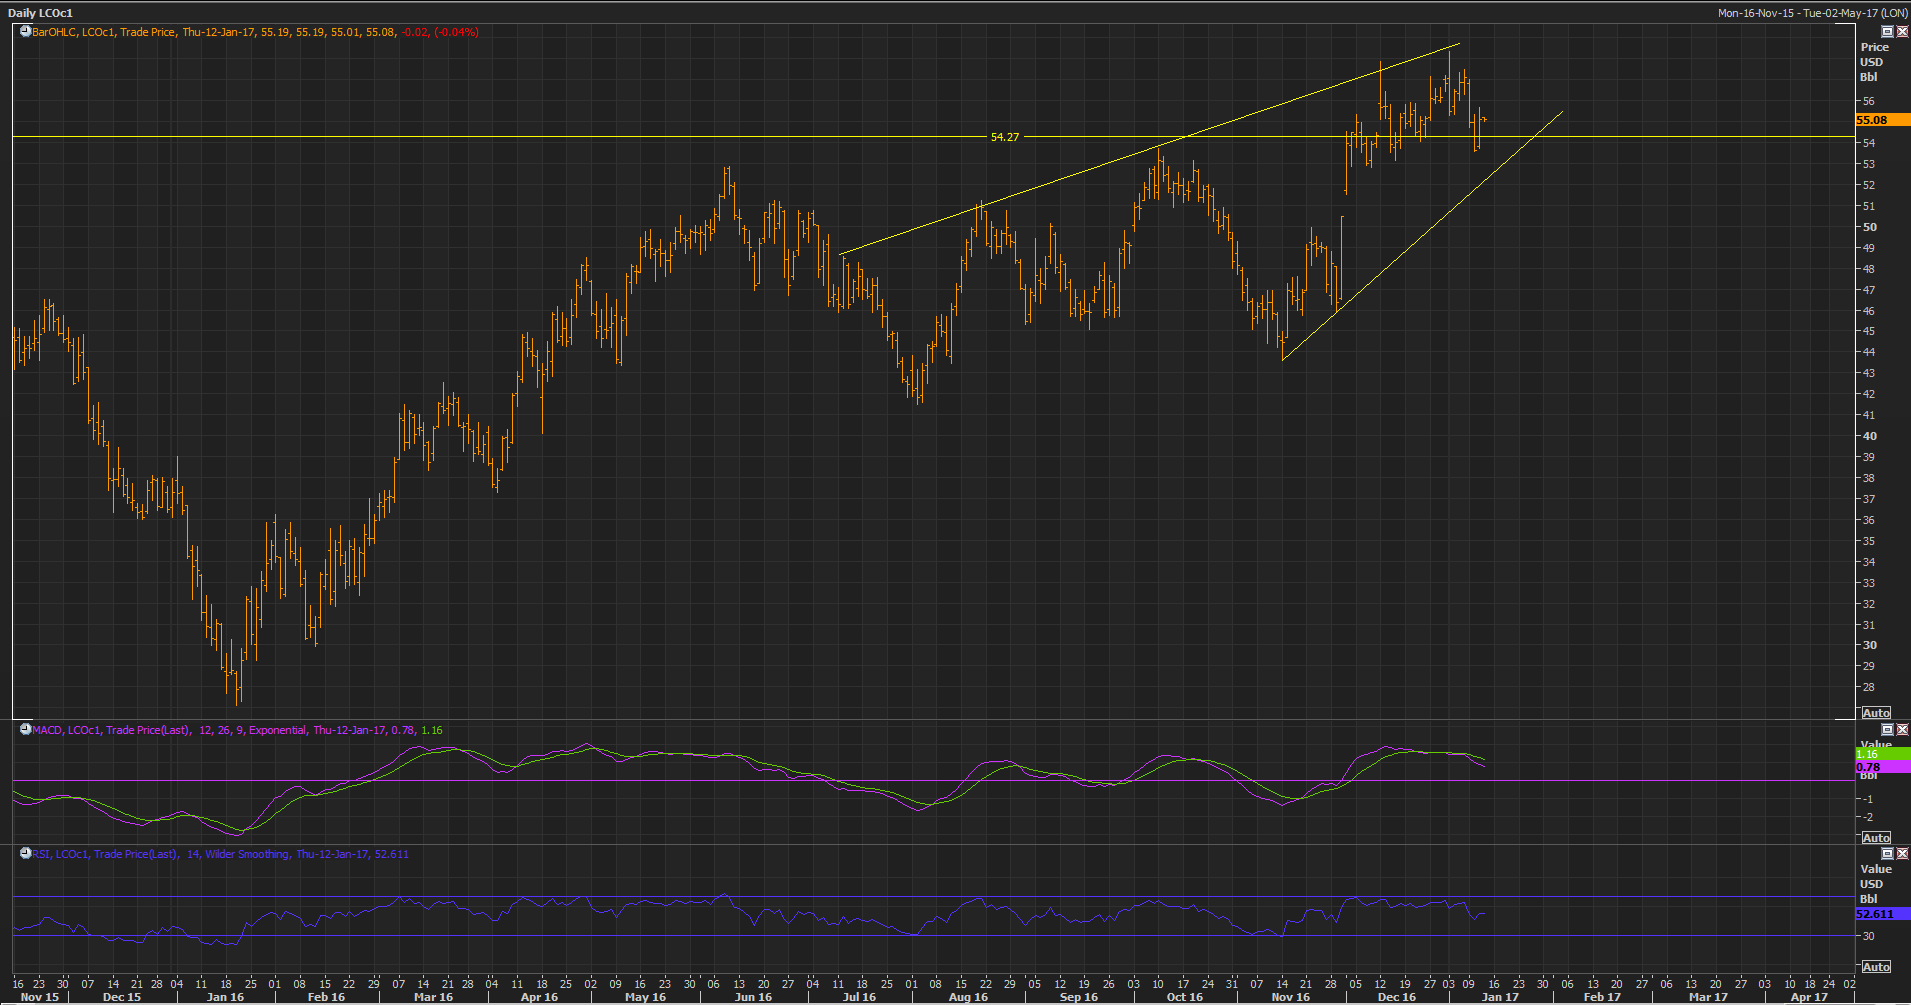
Looking at the technical view, Brent Crude has been trading below the $56 since the beginning of December, with attempts to break above that resistance, but without any chance, which built up a bearish divergence on the daily chart. In the meantime, most of the technical indicators are pointing lower, including RSI and the MACD, which decreases the possibility for another push higher in the coming weeks.
Yet, a bearish outlook is not yet confirmed as there is a daily uptrend line around $52.0 which should be watched very carefully, as a breakthrough that support would increase the possibility for another leg lower toward $50.
WTI Crude Defending $52
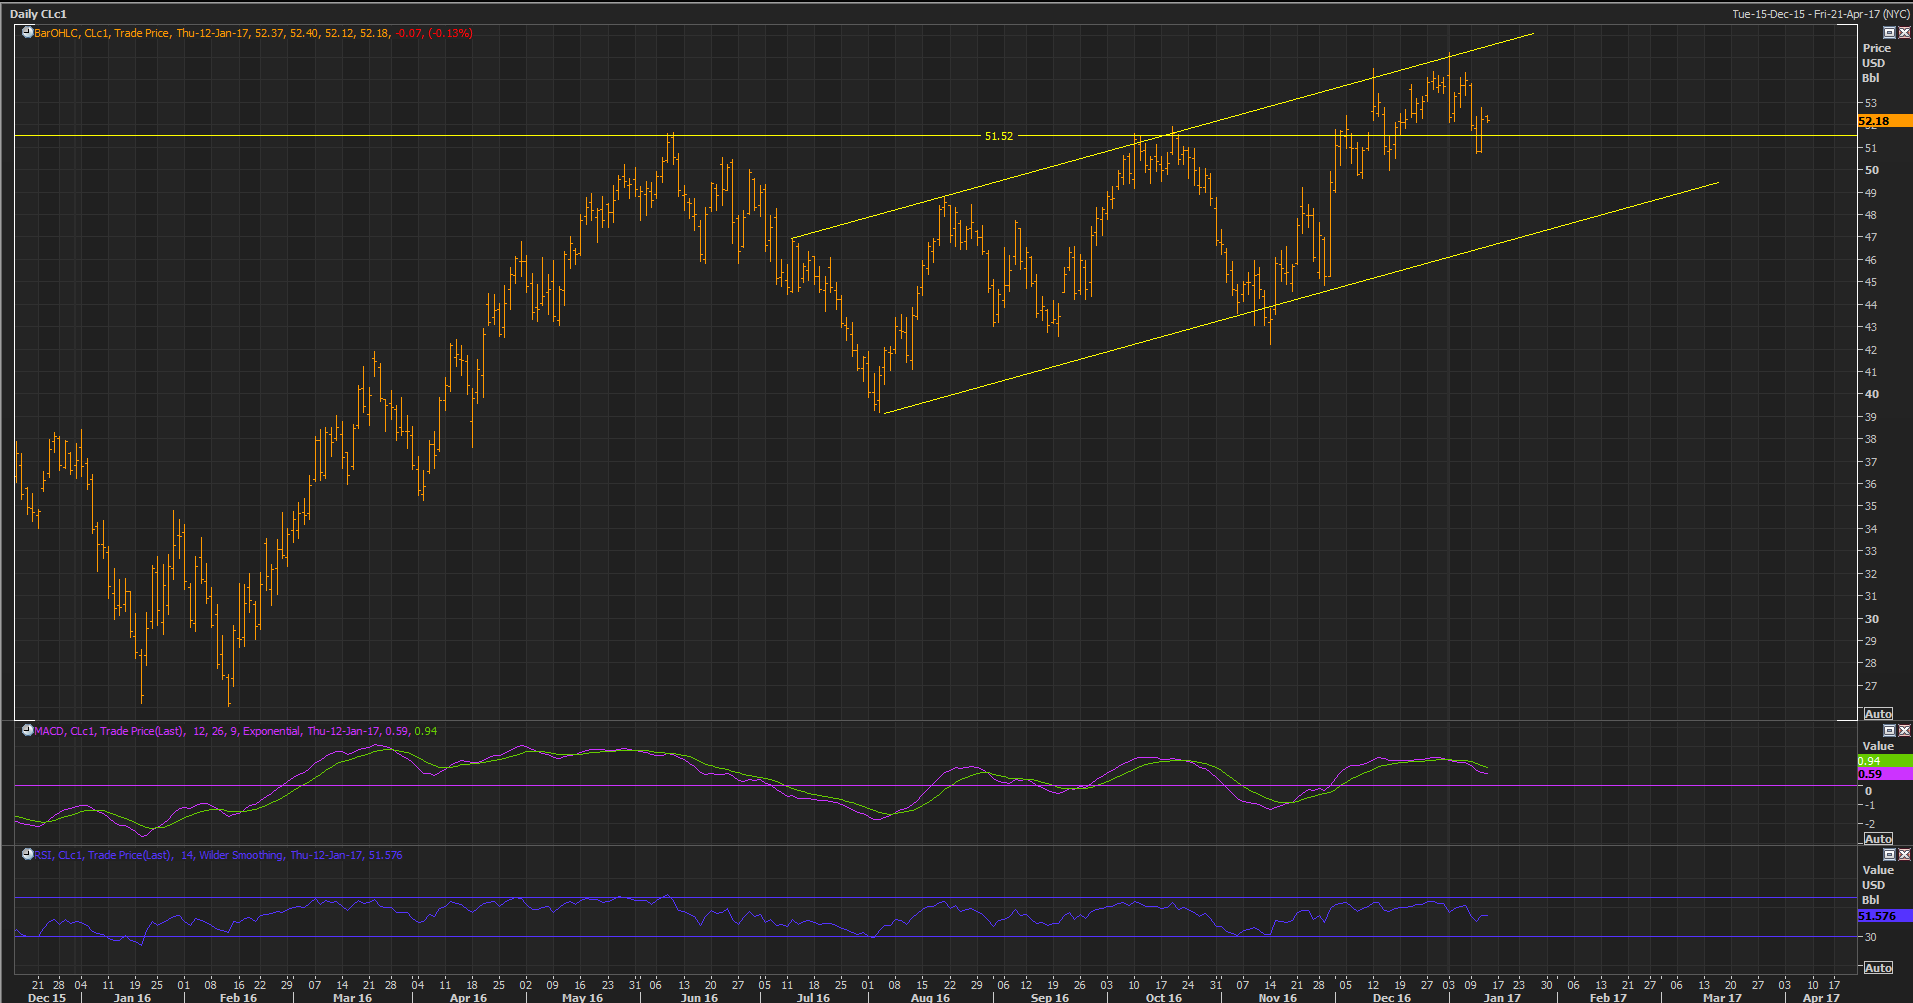
West Texas Crude has almost the same scenario as Brent Crude. A bearish divergence is also there on the daily chart, as it failed to break above the higher line of the uptrend channel, which keeps traders conservative when it comes to longs. Moreover, the MACD and the RSI are both pointing lower, which keeps a higher possibility for further declines ahead.
Yet, $52 remains a solid support for the time being, especially after the clear break above that (resistance back in December) level. Yesterday, WTI managed to close yesterday’s trading above it again, which makes it hard to be broken on the short term. Yet, a breakthrough that support would clear the way for further declines probably back to $50. On the upside view, a break above $55.50 is still needed to confirm another notable rally.
Tight Range?
I would say that crude oil prices will continue to trade within a sideway trend, at least until the end of January, specifically until the OPEC release January’s production levels, where we will experience some notable impact on the market.

![Credit Card 160×600 [EN]](https://assets.iorbex.com/blog/wp-content/uploads/2023/06/13144507/Blog-Banner_EN-Banner_160X600X2.webp)