
The year 2016 is likely to go down in history as the most eventful year for gold traders and investors. After starting the year with a bang, gold prices surged to a two-year high led by uncertain monetary policies and weak pace of growth in the global economy. Gold prices were the most bullish during the first half of the year as the rally gather pace since January 2016 sending price of spot gold to a 2-year high above $1350 an ounce in the first part of the year.
The precious metal, often seen as a safe haven investment got a boost from the geo-political uncertainty which included the July’s Brexit referendum in the UK and the November U.S. presidential elections. The precious metal was no doubt one of the most favorite assets at least in the first half of the year as at one point many institutional analysts and economists alike predicted gold prices to breach the key $1400 an ounce handle.
While many investors were right in calling for higher gold prices as the markets edged closer to the UK’s referendum, investors were caught off guard on the U.S. presidential elections which was touted to be a high risk event that could boost gold prices higher. However, the quick shift in sentiment on the day the Republican candidate Donald Trump won the elections saw the markets adjust to a new shift for investors. Prospects of fiscal spending boosted inflation expectations, lifting the forecasts for the Fed’s rate hikes. This clearly overshadowed other factors such as the president-elect’s rhetoric on trade, immigration and other protectionist policies which moved to the background but still remains a key risk and one that could keep gold prices volatile next year.

Gold volatility is likely to continue into 2017
Even before the president-elect Donald Trump took office, the skirmishes especially with China and the selection of the cabinet members’ points to a potential environment where confrontation remains at the core of Trump’s policies. This could potentially spell volatility and even more so for gold prices which could rise amid any signs of rising geo-political tensions.
While the key risk factors remain in the U.S., in the Eurozone the upcoming elections in Germany, France and Netherlands will also add to the volatility in gold prices. The rising anti-EU sentiment across the major eurozone economies could only spell more trouble to the biggest monetary and geo-political experiment in the world. Across the channel, the UK is set to prepare a formal exit process as early as March. There are a lot of variables in play including the new leadership in France and Germany that could either make Brexit a hard process or could lead to a smoother exit from the economic bloc.
On monetary policy, the markets are enthusiastic about the current tightening cycle from the Federal Reserve. At its meeting in December, the Fed signaled three rate hikes in 2017. However questions remain on how much of fiscal stimulus will be announced by president-elect Donald Trump and even more important will be whether the stimulus plans will stoke growth or inflation, coming this late into the economic cycle.
There are a lot of potential unknowns, which means that writing off gold at this point in time would be premature.
Spot Gold – Long Term Technical Outlook
Looking at the monthly charts, we can see the longer term trend is biased to the downside. This year’s rally towards the 1370 region can be viewed as a correction to the downtrend with prices seemingly pushing lower. However, the pace of declines is likely stall as gold prices approach the support zone between 1144.00 and 1055.00. A break down below 1055.00 could signal further declines that could send gold prices lower towards the key psychological support of 1000.00.
Alternately, the price action also suggests that gold prices could be looking to form an inverse head and shoulders pattern, subject to a reversal near the 1150 – 1140 region. As long as the previous low near 1055 is not breached, gold prices could be seen pushing back to the 1375 – 1390 handle which could come in as a neckline resistance level.
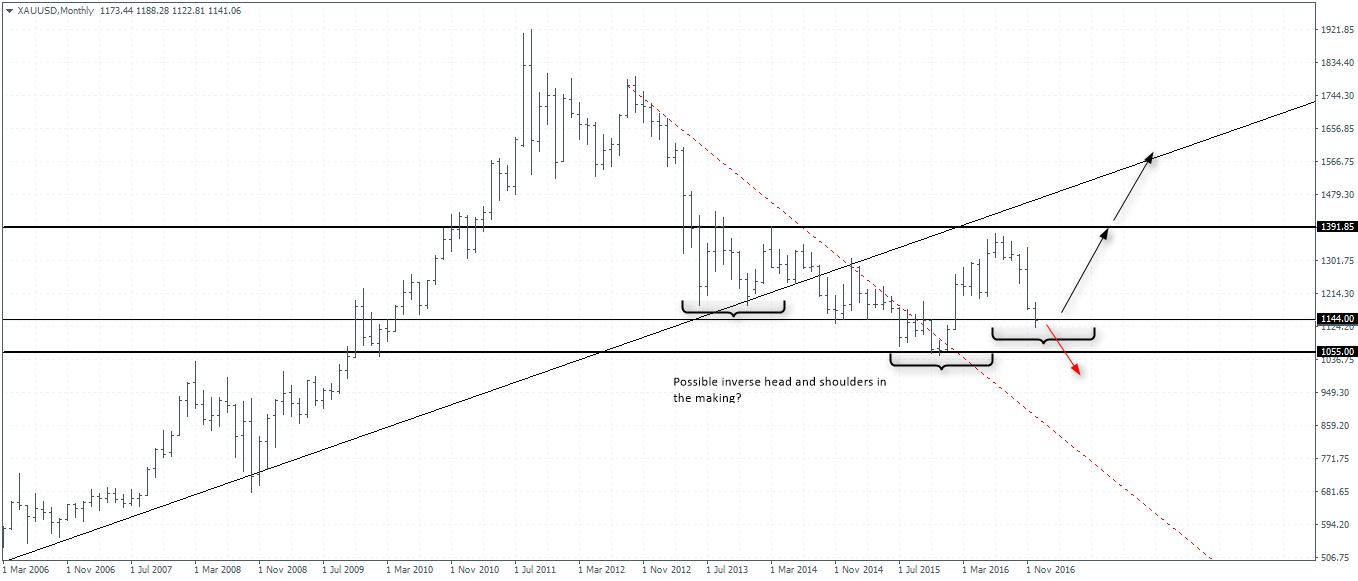
While gold prices have so far been in a steady downtrend, the apparent outlook points to balanced risks in the near term. This is further complicated by the upcoming geo-political risks amid monetary policies that are clearly not out of the woods yet. For the moment, investors need to keep an eye on the 1150 – 1050 region which could potentially signal the near medium term outlook for gold prices.

