
The first trading day of the week was lacking fundamentals. It had low liquidity and a low trading volume. However, the US Dollar ticked higher almost across the board. Today, a few economic figures will be released during the European and US sessions, which may have a medium impact on the markets. One of the main figures is the ZEW Economic Sentiment for Germany and the Euro Zone. So What is this index and how might the market react to its outcomes?
Definition
ZEW Economic Sentiment: this index is a diffusion index based on surveyed German institutional investors and analysts. A survey of about 275 German institutional investors and analysts is conducted, asking respondents to rate the relative 6-month economic outlook for Germany in that specific time period.
Why Is This Important?

It is a leading indicator of economic health – investors and analysts are highly informed by virtue of their job, and changes in their sentiment can be an early signal of future economic activity.
How To Read The Outcomes
Generally speaking, a figure above 0.0 indicates optimism while anything below 0 indicates pessimism. The ZEW survey is historically focused on the German economy, and Germany tends to lead the Eurozone economy, so the overall Eurozone outlook tends to be overshadowed by the German data that is released at the same time.
However, traders are also advised to look at what is called the “ZEW Current Conditions” which measures the sentiment of the current business situation (factual present) rather than the potential situation (expectations).
Market Expectations
| Economic Indicators |
Forecast |
Prior |
| German ZEW Economic Sentiment |
4.2 |
0.5 |
| German ZEW Current Conditions |
55.5 |
55.1 |
| EU ZEW Economic Sentiment |
6.3 |
5.3 |
Recent Data
The ZEW Economic sentiment has been deteriorating since it peaked back in March of last year, declining all the way from 55.0 to -6.8 in July of this year, before recovering back to 0.5 in its latest reading in August. The estimates today are slightly positive, but it would be the third consecutive positive monthly reading, which would keep the estimates higher for a possible end of the current ECB QE. If the outcomes come as expected, this would be the highest reading since June of this year. However, the Current Conditions Index has been within a tight range since March of last year, hovering around the 55-60 areas.
EURUSD Outlook
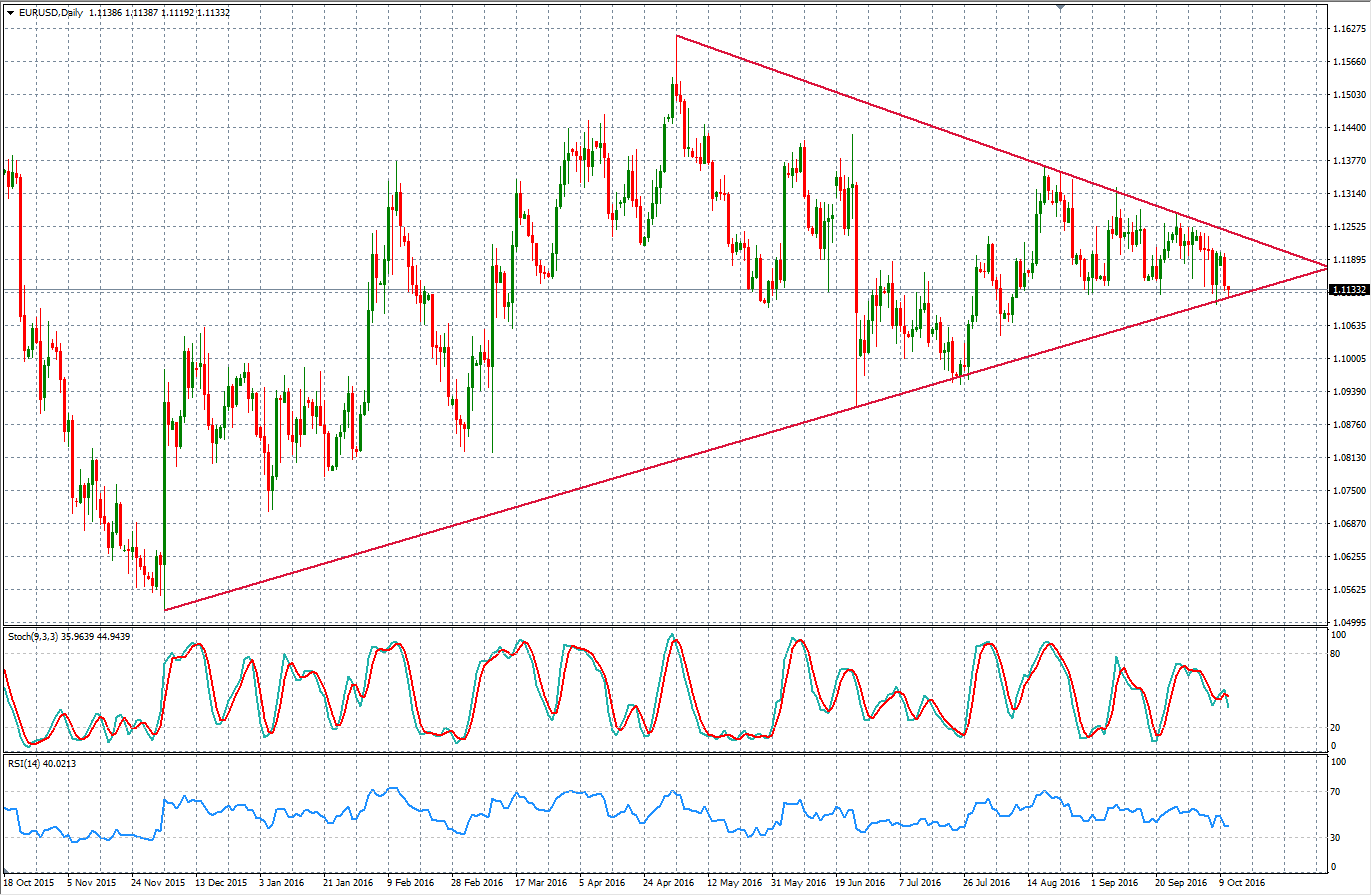
The pair has been declining since Mid-August from the resistance area at around 1.1350 all the way down to 1.1127 during the previous Asian session today. Today’s low represents a medium term up trend line on the daily chart, which lasted since November of last year. Therefore, today’s figures might be the catalyst for another short term bounce according to the expected figures. The bullish outlook remains as long as the pair stays above that trend line. Otherwise, another leg lower could be seen ahead.
Levels To Watch
| Symbol |
S3 |
S2 |
S1 |
Pivot |
R1 |
R2 |
R3 |
| EURUSD |
1.1035 |
1.1081 |
1.1110 |
1.1156 |
1.1185 |
1.1231 |
1.1260 |
| EURJPY |
114.24 |
114.62 | 115.01 | 115.39 | 115.78 | 116.16 |
116.55 |
| EURCHF |
1.0864 |
1.0894 | 1.0919 | 1.0949 | 1.0974 | 1.1004 |
1.1029 |
| EURGBP |
0.8910 |
0.8943 | 0.8977 | 0.9010 | 0.9044 | 0.9077 |
0.9111 |

