
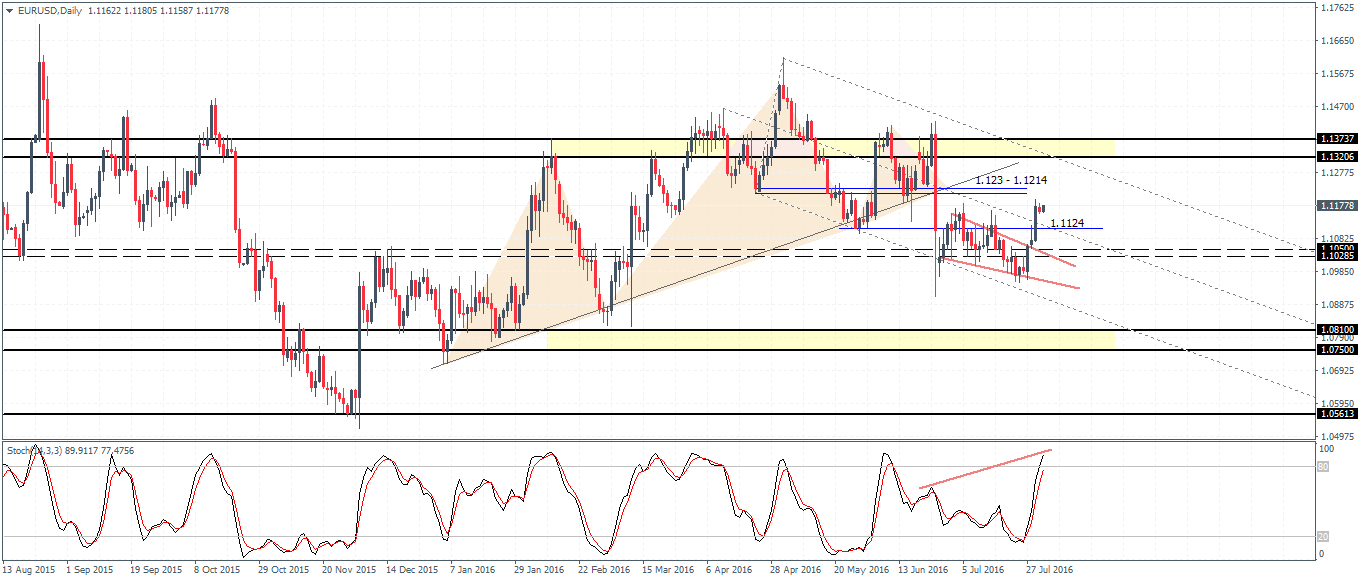
EURUSD (1.1177) posted strong gains last week after price remained in a consolidation mode for the most part. The breakout above 1.105 saw price close last Friday just below the identified resistance level of 1.123 – 1.1214. The longer term bearish head and shoulders pattern continues to remain in play with a retest of the resistance level of 1.123 – 1.1214 likely to be tested before anticipating further declines.
In the near term, EURUSD has the scope for a pullback to 1.1124 region which marks the minor support level after prices broke out last week. The Stochastics on the daily chart shows a hidden bearish divergence. Therefore, a potential reversal near 1.123 – 1.1214 is likely to set the stage for further declines. In the event that EURUSD breaks above this resistance, we can expect the gains to extend towards 1.130 – 1.1326 level.
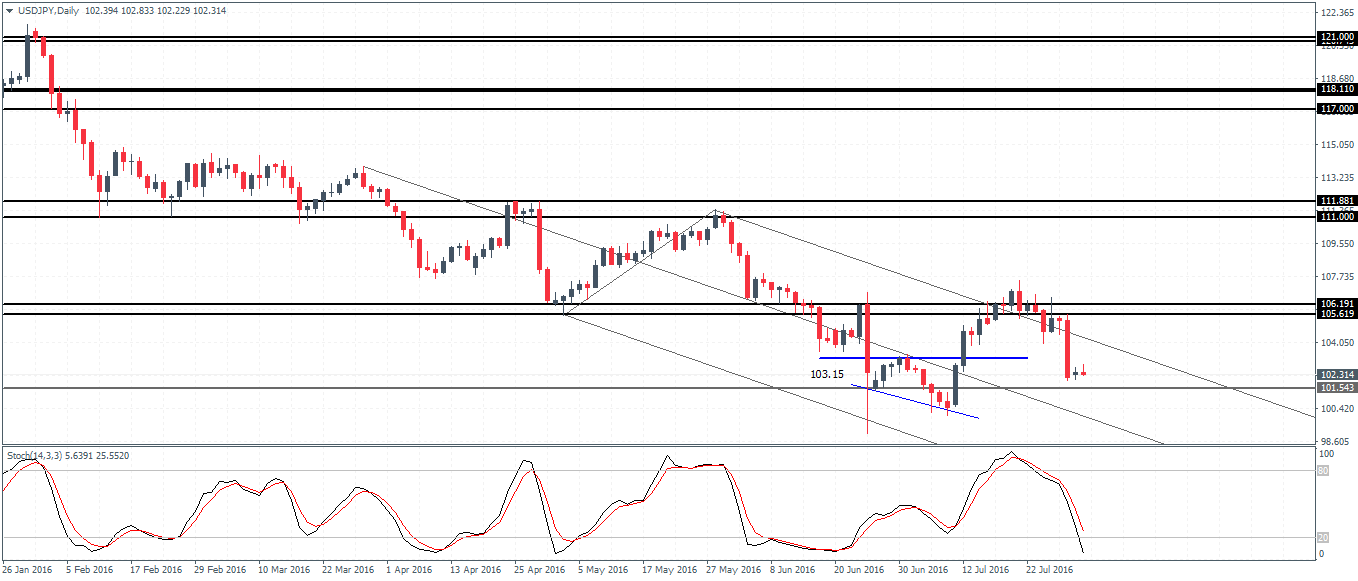
USDJPY (102.31) has been steadily declining after price failed near the resistance of 106 – 105.6 region. Currently, the decline extended below 103.15 which was previously noted. Still, the support zone at 103.15 – 101.54 is likely to keep USDJPY’s declines limited for the moment. The bearish view will gain precedence, on a daily break below 101.54 with a validation shown by a possible bearish candlestick pattern near this level. Watch for the Stochastics to make a crossover near the 20 level and validated by a possible bullish candlestick pattern for a retest back to 105.61 – 106.19 resistance level.

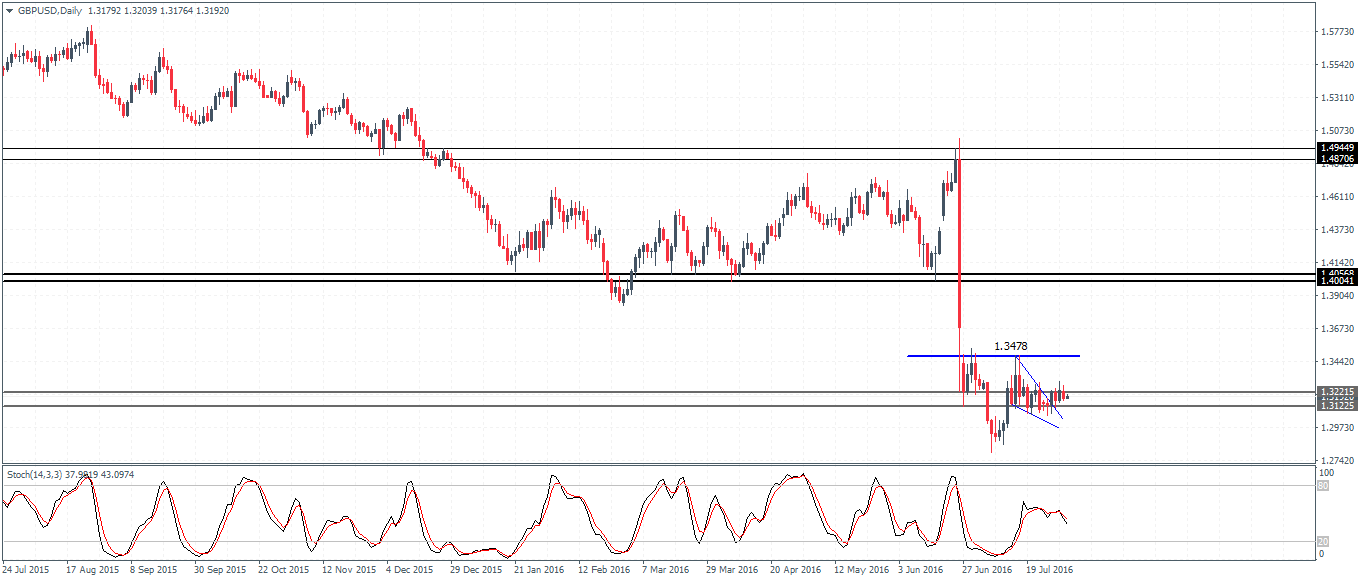
GBPUSD (1.319) had formed a bullish pennant pattern but the lack of follow through puts this pattern to question. Still, the daily chart shows the potential for an inverse head and shoulders pattern with the neckline resistance seen at 1.3478. Price action currently remains strongly consolidating near 1.322 – 1.3122 support level. A break down from here could extend the declines down to 1.30 and invalidate the bullish pattern. To the upside, a breakout above 1.3478 will see GBPUSD extend its gains towards 1.38 and eventually to 1.40.
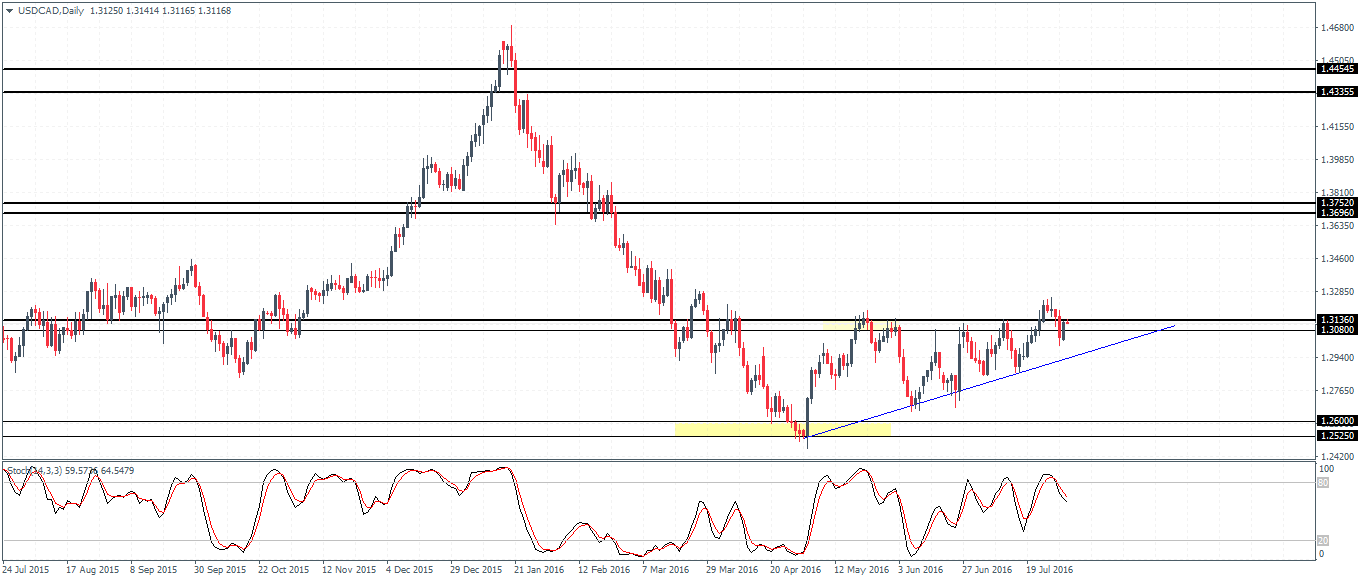
USDCAD (1.3116) attempted to breakout from the resistance zone at 1.3136 – 1.308 but price action quickly dipped back lower. The ascending triangle remains in play and price action could see further upside from here, as long as the trend line connecting the lows of 1.2529 and 1.2692 from May 2nd and June 8th is not breached. To the upside, the target remains at 1.369 – 1.375 subject to a more valid breakout from the current resistance level. Alternately, in the event that price breaks below the rising trend line, a dip back to 1.26 – 1.2525 cannot be ruled out.
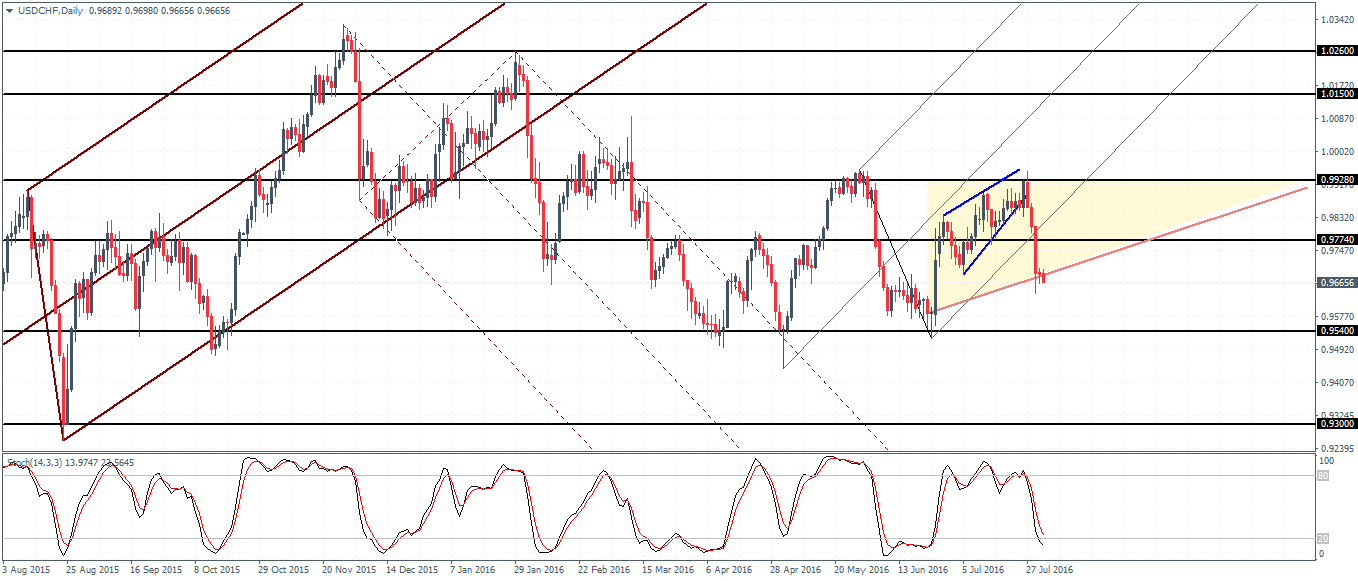
USDCHF (0.9665) has posted steady declines following the rising wedge pattern. The declines gained momentum on a breakout below the minor resistance at 0.9774. The current price action is still carving out a potential ascending triangle pattern. Therefore a potential reversal near the current levels could signal a near-term correction. 0.9774 will likely act as resistance and a break above this resistance will see prices extend gains towards the previous main resistance at 0.9928 which has kept a lid on prices twice so far. Alternately, a continued decline could see USDCHF slide towards the lower support identified near 0.954.

![Credit Card 160×600 [EN]](https://assets.iorbex.com/blog/wp-content/uploads/2023/06/13144507/Blog-Banner_EN-Banner_160X600X2.webp)