
Market Context: It is fairly evident that the markets have been trading rather flat. With no clear indication on the prospects of US monetary policy, the markets have settled into ranges focusing on the macro developments. The US economy hit a rough patch with the quarterly nonfarm productivity and Friday’s retail sales report both disappointing.
On the broader scale, the week ahead is expected to remain quiet as well with the FOMC meeting minutes and Fed member speeches likely to bring some noise to the markets.
Chart 1: Spot Gold, XAUUSD (1336.97)
Gold prices attempted to breakout above $1350 for the past three days but failed to do so with Friday closing out with an outside bar. Near term declines can be expected in gold prices with support at 1315 – 1300 very likely to be tested in the near term. The bearish bias is validated by price action seen trading within the falling median line which could indicate further declines if support at 1315 – 1300 fails to hold the declines.

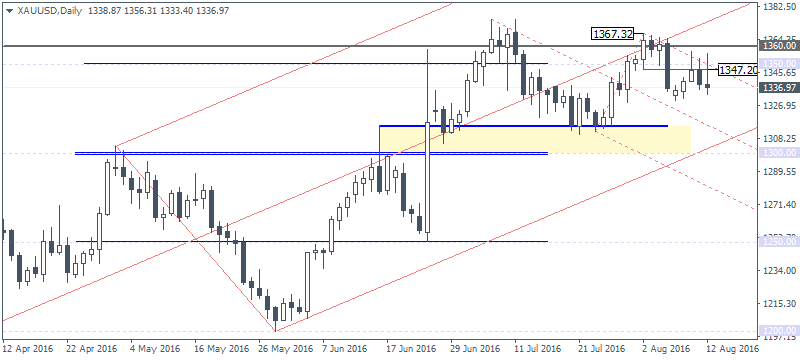
Chart 2: USDCAD (1.296)
USDCAD has likely reversed the medium term trend after prices failed to post new highs above 1.32. The subsequent decline and the retest to just below 1.32 could signal a change or a correction to the previous rally from 1.27 lows. In the near term, USDCAD could be seen trading range bound with resistance at 1.30 and support at 1.29. Friday’s price action closed with a spinning bottom, and a bullish follow through which could signal a near-term correction to 1.30. As long as the price gains remain limited to 1.30, we could expect USDCAD to slide towards 1.29 to retest the support level.
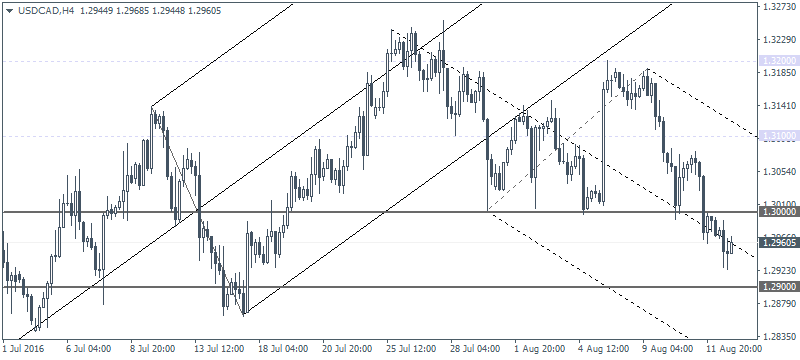
Chart 3: AUDUSD (0.7648)
AUDUSD closed bearish on Friday coming off Thursday’s doji pattern near the top end of the rally indicating a near-term correction. On the 4-hour chart, we notice price hugging the lower median line. Any bounces off this lower median line could see price retest 0.767 – 0.77 price level ahead of further declines. Support is seen at 0.76.
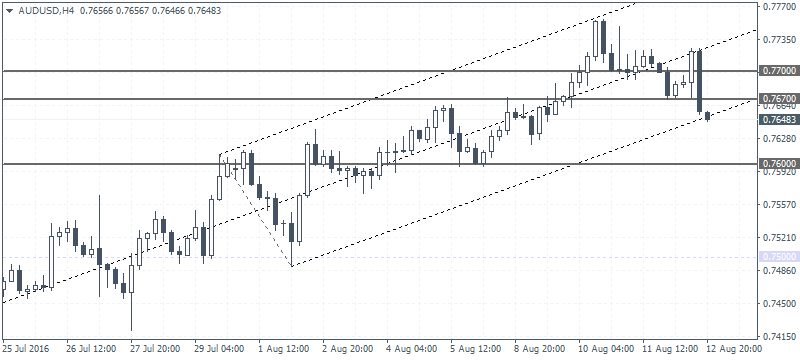
Chart 4: NG_6U (2.59)
Natural Gas futures for September delivery closed on Friday at 2.59. On a daily session, NG_6U closed on a bullish note which could indicate a near-term correction to the upside. On the 1-hour chart, we notice a hidden bearish divergence which saw prices reverse near 2.61 which previously served as support and now acting as resistance. A near decline towards 2.550 could be expected ahead of further gains to the upside. In the medium term, Natural gas futures are likely to aim for 2.715, following a breakout above 2.61.
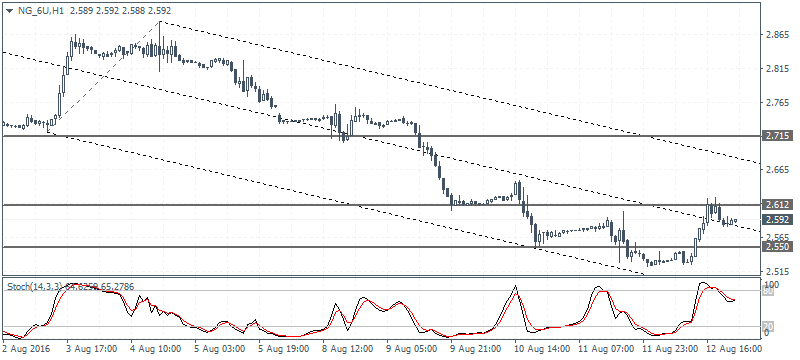
Chart 5: USDTRY (2.957)
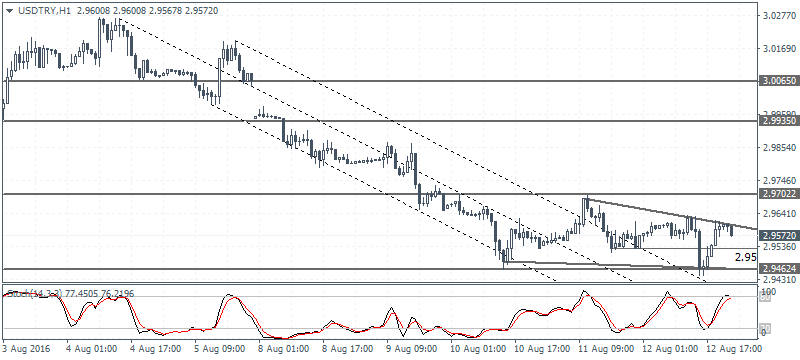
USDTRY formed an inside bar on Thursday with Friday showing a fake breakout to the downside. The inside bar’s range was formed at 2.9702 – 2.9462. On the hourly chart time frame, price action has been consolidating into a triangle pattern which could signal a near-term breakout, preferably to the upside. Watch for the price to dip towards 2.95 in the near term ahead of a breakout. The hourly chart’s bullish divergence points to a USDTRY correction towards 2.97 followed by 2.99 and 3.006.

