Which Instrument & Time Frame?
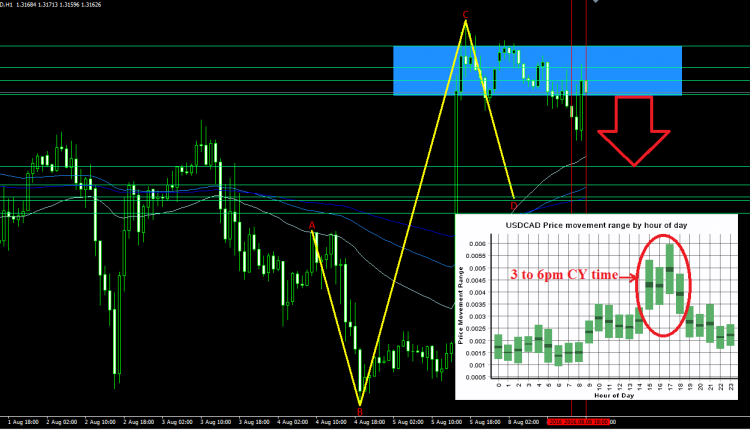
As shown in the chart above, the USD/CAD on a 1Hr chart at the time of analysis was trading at the 1.3165 area.
Which direction?
Overall, based on the three time-frames; 1Hr, 4Hr & the Daily chart, this pair appears to be moderately Bullish.

What pattern?
From a ‘Geometric ’pattern’s perspective, a Bullish ‘Z’ pattern is believed to have formed offering a Short opportunity if one is entering the trade from C to D. It’s potentially undergoing a correction reaching out to the blue zone before [potentially before making the plunge.
How to Trade it?
Geometrically speaking, intraday traders could benefit from a short-term Short trade with an ideal entry below the psychological 1.3150 level aiming your ideal TP before prices reaching the next psychological area of 1.3120/00 . As for the Stop Loss (SL) level, one could apply the 1:1 risk to reward ratio where the number of pips you are willing to risk could equal the number of potential pips in profit. There is still an approximate 20 to 30 pips gap to the TP level if prices are not too far off the price mentioned of where it is trading at present.
Happy Geometric Pipping !

