
Market Summary
- RBNZ lowers OCR by 25bps to 2.0%
- NZD unmoved by RBNZ’s “timid” rate cut
- French CPI confirmed at -0.40% in July 2016
- Oil prices extends losses on build up in weekly oil inventory
- US jobless claims below 270 for sixth consecutive week
- US import prices rise 0.10% in July
- US import prices for June revised from 0.20% to 0.60%
Today’s Economic events
- RBNZ OCR 2.00% vs. 2.00%
- RBNZ releases monetary policy statement
- UK RICS house price balance 5.0% vs. 19.0%
- Australia MI inflation expectations 3.50% vs. 3.70% previously
- RBNZ Gov. Wheeler speaks
- France final CPI m/m -0.40% vs. -0.40%
- Canada NHPI m/m 0.1% vs. 0.20%
- US weekly unemployment claims 266k vs. 270k
- US import prices m/m 0.10% vs. -0.20%

Coming Up
- New Zealand Manufacturing index
- New Zealand retail sales
RBNZ cuts OCR to 2.0%, signals further easing
The Reserve Bank of New Zealand cut the overnight cash rate or OCR by 25 basis points to 2.0% as widely expected. In the statement following the rate cut announcement, the RBNZ said in a strongly worded statement that the OCR could drop even lower, with the monetary policy statement showing, “further policy easing will be required to ensure that future inflation settles near the middle of the target range.” The RBNZ’s statement also showed that the central bank was concerned with inflation and not so much with stimulating the economy as the central bank expects inflation to remain low for a long period of time.
The RBNZ forecasts that inflation could rise to 1.0% by end of this year, trading near the lower band of the RBNZ’s 1 – 3% inflation target range with the near term weakness in inflation coming from a stronger New Zealand dollar. On an annual basis, New Zealand’s inflation rate is expected to rise only in the second half of next year, but still the RBNZ remained doubtful of inflation reaching the 2% mid-point target until September 2018.
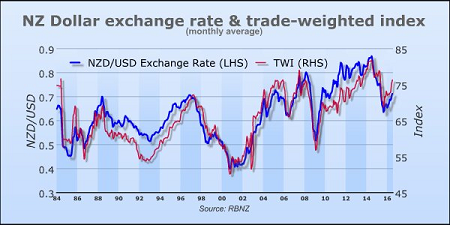
The New Zealand dollar was bullish post RBNZ’s rate cut announcement, despite references to the exchange rate where the monetary policy statement said, “The trade-weighted exchange rate is significantly higher than assumed, while headline inflation is being held below the target band by continuing negative tradables inflation.” Ray Attrill, from ANZ said, “the market had been flirting with the idea of a 50 basis point cut, so it is no surprise to see the kiwi rally.”
France Consumer Price Index falls 0.40% in July
French CPI declined by 0.40% in July on a month over month basis, data from statistics agency, Insee showed on Thursday. The 0.40% decline was in line with flash estimates released earlier in July. The 0.40% declines come following June’s modest increase of 0.10%. On a year over year basis, French CPI rose by 0.20%, rising at the same pace as the month before.
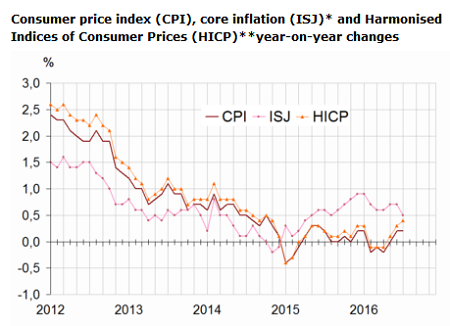
Insee said that the drop in July’s inflation was due to summer sales on account of seasonal fall in prices of manufactured goods which fell 2.90%. Energy prices also fell on the back of petroleum products. This was the first decline in energy prices after rising for four consecutive months. In July, energy prices were down 1.30% on a month over month basis while declining 3.30% on a year over year basis. Petroleum products were down 2.40% on the month. Prices of services sector increased, rising 1.0% on the month and 0.80% compared to a year ago. The increases came mostly from higher accommodation services which showed a 10.30% increase over the month, but is seen to be weaker, 0.20% on a year over year basis.
Food prices remained largely flat, rising only 0.10% in July but maintaining a steady pace of increase, rising 1.20% on a year over year basis. Core inflation in France was seen falling by 0.10% on a month over month basis.
Crude oil prices fall on weekly inventory data
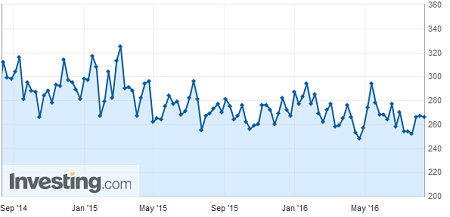
US crude oil inventories released on Wednesday by the Energy Information Administration (EIA) showed that commercial stockpiles of crude oil increased 1.1 million barrels for the week ending August 5th, 2016. The buildup in stockpiles missed analyst forecasts of a drawdown of 1.3 million barrels instead. Price of WTI Crude oil futures for September delivery fell sharply on the day, closing at $41.49 a barrel, posting a two-day low. The bearish trend continued into early Asian trading today on August 11, with Oil prices seen trading at $41.26 a barrel or down 0.50% for the day.

After a brief period of lull, oil prices are back in the headlines this week after OPEC released a statement that the members of the oil producing nations would meet in September on the sidelines of the IEA oil forum meet in Algeria. WTI Crude oil prices witnessed a sharp decline in the month of July this year, losing over 14% during the month amid oil storage tanks worldwide reaching full capacity. Tariq Zahir from Tyche Capital Advisors said, “At this time of year, we should be drawing down in crude inventories, and we are still building. We do feel that any further strength in the spot price will be met with selling.”
The EIA also scaled back its bullish picture on oil’s supply and demand on Tuesday with new forecasts showing that the agency now estimates oil output to decline in the remainder of 2016. EIA now expects US oil output to fall by as much as 700k barrels per day in 2016, to 8.73 million barrels. This was lower than its previous estimates of a decline of 820k barrels per day.
US import prices rise in July for the second month
Import prices in the US increased 0.10% in July, indicating that consumer price increase could be around the corner, data from the US labor department showed on Thursday. On a year over year basis, import prices were down 3.70%, staying subdued for nearly two years. July’s import price data was slightly below forecasts of 0.20% increase. June’s import prices were also revised higher from previously reported 0.20% to 0.60%.
The increase in import prices was attributed to higher non-petroleum imports which included industrial and food supplies. Excluding petroleum products, import prices increased 0.50%, posting the biggest month over month gains seen since April 2011. Nonpetroleum industrial supplies increased 2.10% in July while food and beverage prices increased 3.30%. Petroleum import prices were down 3.60%.
In a separate report, the weekly unemployment claims showed that initial claims for unemployment benefits fell by 1000, to 266k in the week ending August 5, slightly below expectations of 265k. The data marked by the 6th consecutive week of jobless claims holding below 270k. The report was released by the US Labor department on Thursday. The four-week moving average for initial claims rose by 3000 to 262,750. The labor department said that there were no special factors in the weekly jobless claims data.

