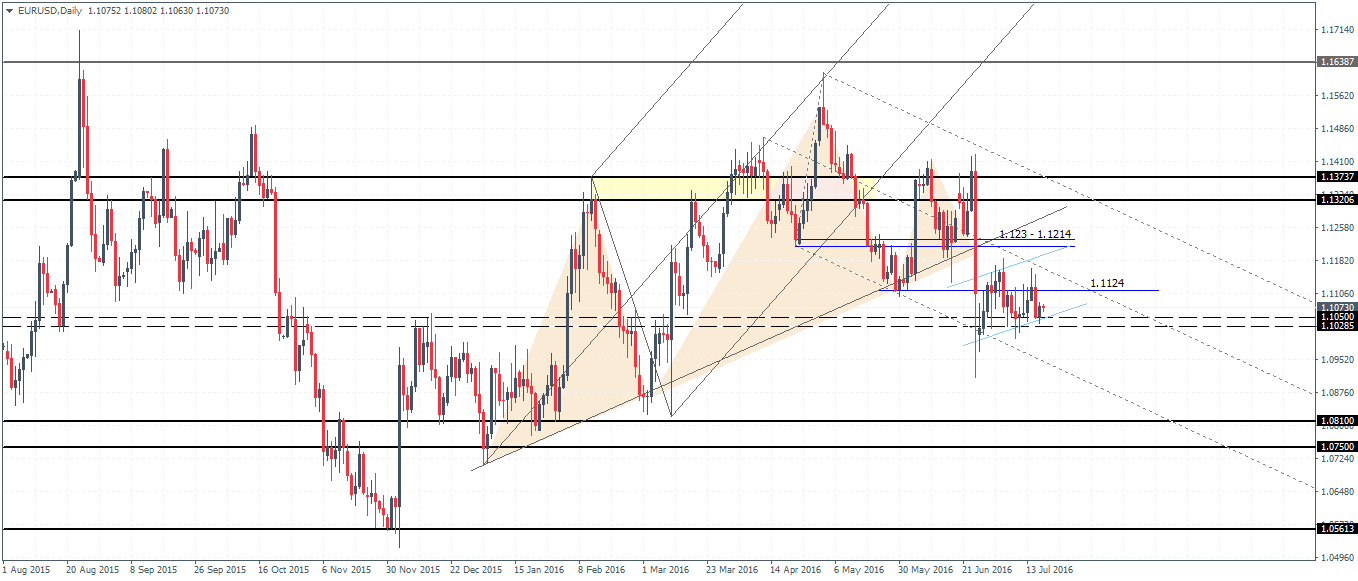
EURUSD (1.107): EURUSD has been posting a strong consolidation following the breakout from the head and shoulders neckline support level. Currently, 1.105 – 1.1028 remains a strong support level that has kept prices biased to the upside. Further declines, therefore can be expected only a strong breakout below 1.10285 support. To the upside, above 1.1124, we could expect to see EURUSD retest 1.123 – 1.1214 level, with the potential for EURUSD to test 1.132 resistance level as well.
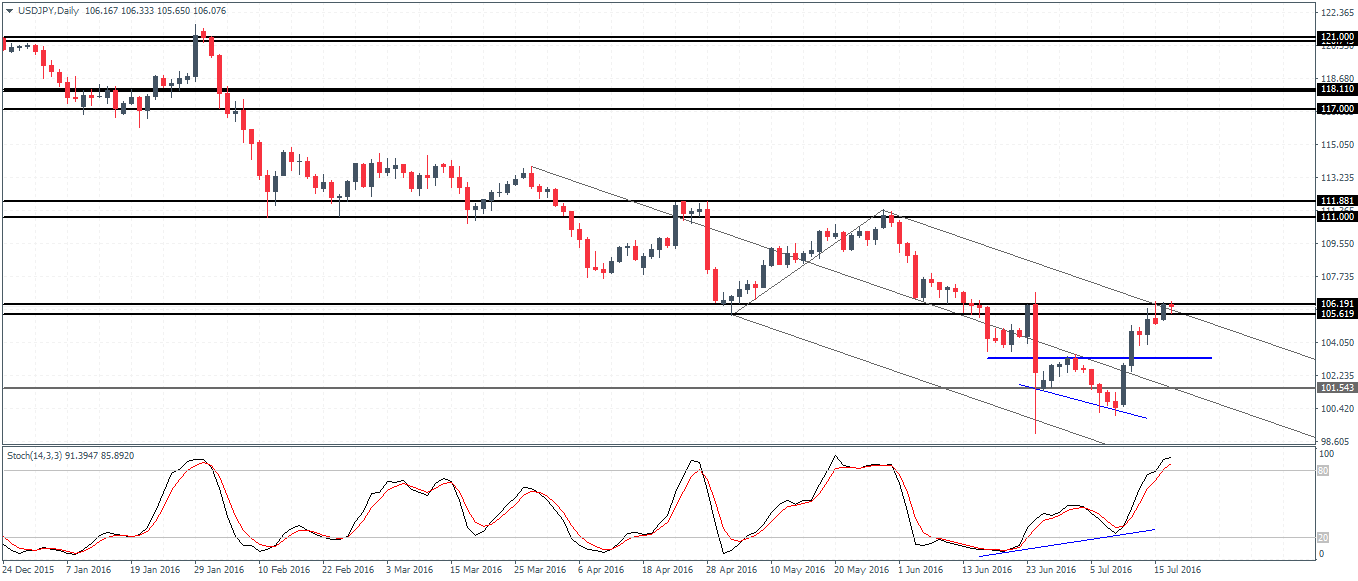
USDJPY (106.07): USDJPY posted steady gains after bouncing off the 101.54 support level. Price action is currently caught near the resistance level of 106.19, which was tested previously around late June this year. In the near term, a correction to the downside can be expected, with 103.20 likely to act as support level. Testing support here could potentially keep USDJPY biased to the upside and following a breakout above 106.19 resistance, further upside could be expected, towards 111.0. Alternately, failure to establish support at 103.20 could keep USDJPY range bound with further declines expected on a break below 101.5 support.

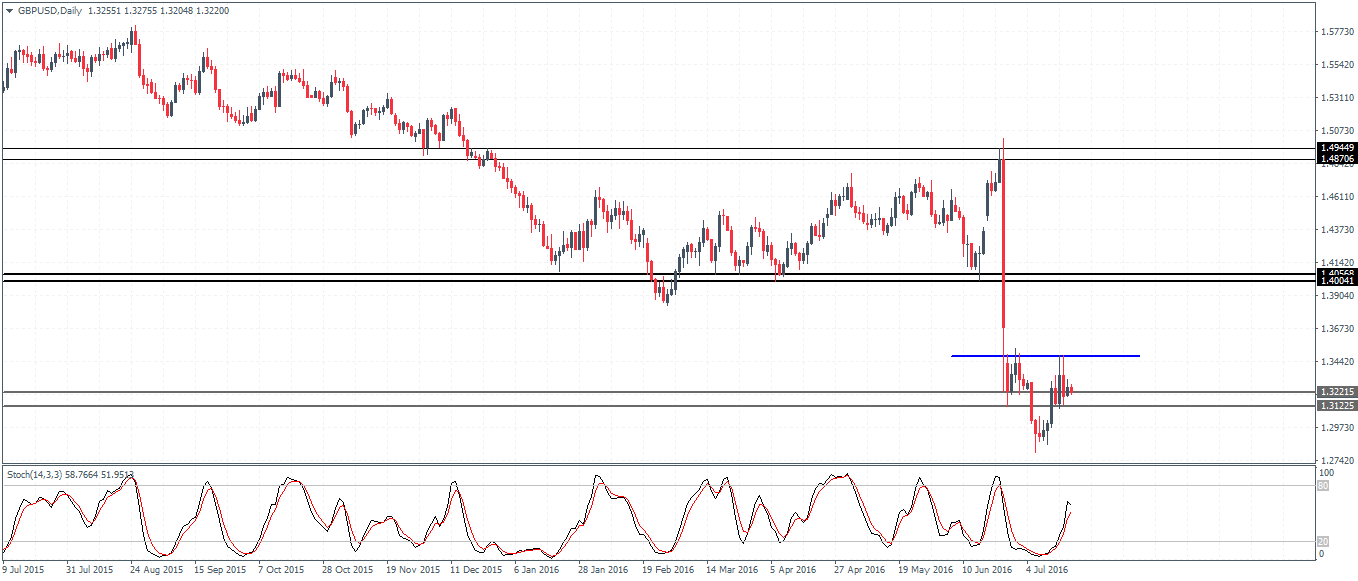
GBPUSD (1.322): GBPUSD has managed to close back above the key price level of 1.322 – 1.3122. The consolidation seen currently could potentially form a small inverse head and shoulders pattern. As long as prices do not fall back below the previous low near 1.28, we could expect to see the right shoulder forming with a higher low. The neckline resistance is seen at 1.374 and a breakout above this level could signal a move to 1.40 eventually.
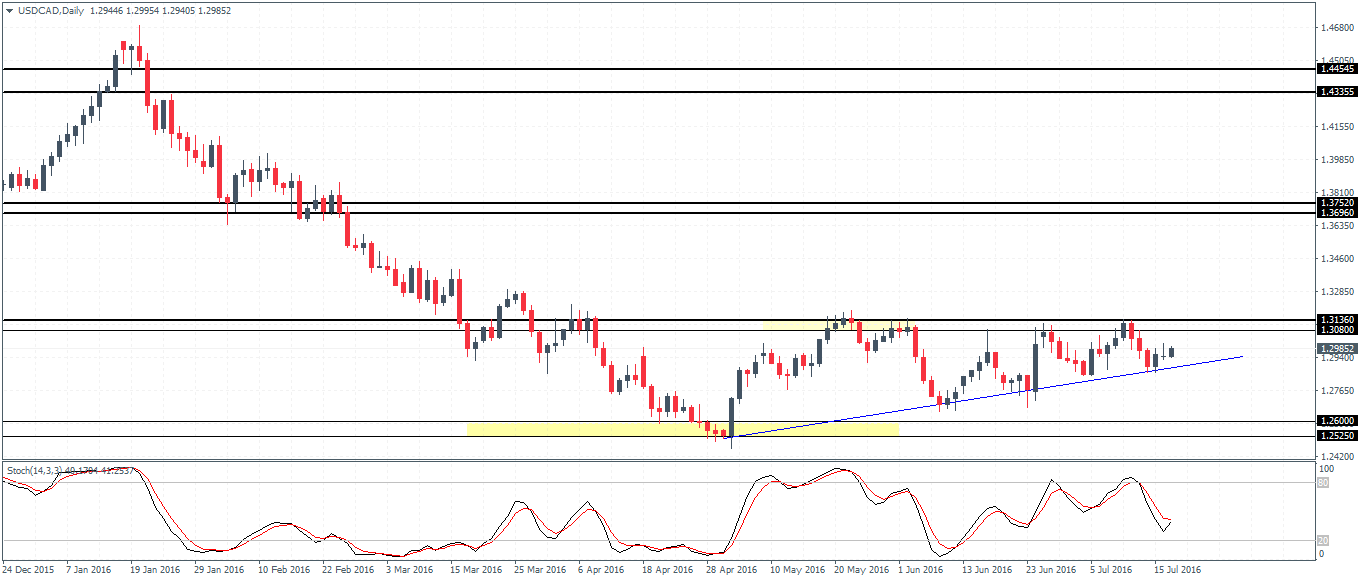
USDCAD (1.2985): USDCAD has failed to clear the resistance near 1.3136 – 1.308 level, having tested this resistance for nearly four time so far. Meanwhile, the dips have become increasingly smaller and could indicate a potential upside breakout. In this case, the ascending triangle pattern could be validated and we could expect further upside towards 1.37 – 1.375 resistance level. To the downside, a breakout below the rising trend line could see USDCAD slide towards 1.26 – 1.252 support.
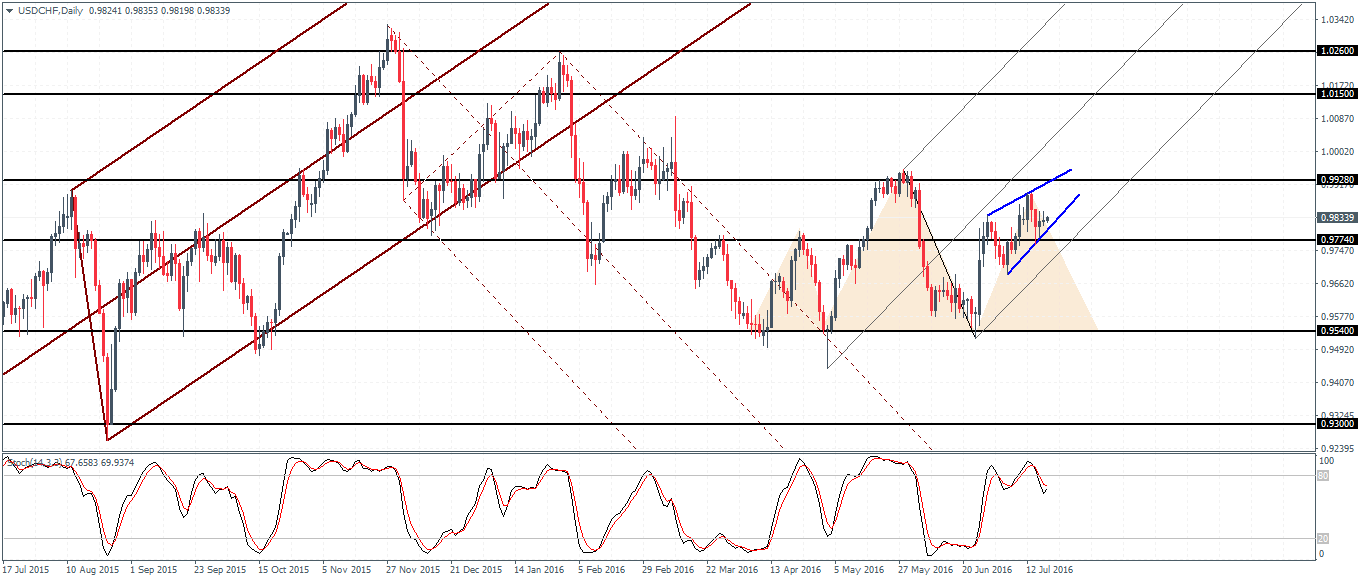
USDCHF (0.9833): USDCHF has been ranging above 0.97740 and remains carving out the head and shoulders pattern. Currently, we see the consolidation taking shape into a rising wedge pattern. A downside breakout from this rising wedge and below 0.9774 could signal further downside with price likely to slide towards 0.9540. This would potentially mark the head and shoulders pattern and subject to a breakout below 0.954 neckline support, further declines can be expected towards 0.93