
WTI Crude oil prices gained strongly yesterday, ending 4.20% higher for the day at $49.88. The gains in the Crude oil markets came after a larger than expected drawdown in the inventory report. Data from the US Energy Information Administration said crude oil stockpiles fell 4.1 million barrels for the week ending June 24, posting a sixth consecutive week of draw downs in inventory. Analysts forecasted a 2.4 million drawdown. Earlier in the week the API’s independent report showed a drawdown of 3.9 million which also showed a sixth consecutive week of declines and more than the expected draw of 2.4 million barrels.
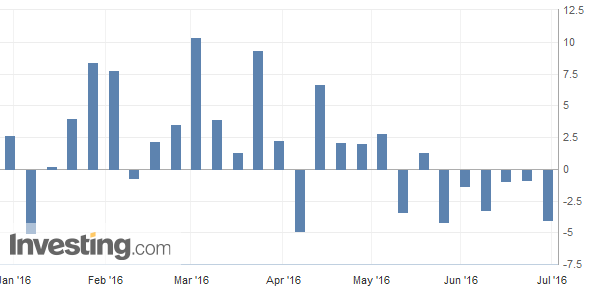
Cushing stocks extended their declines, falling 1.21 million barrels while gasoline stocks fell 0.42 million in the week. Distillate inventories also posted a draw of 0.83 million. Oil prices are seen to be also seasonally supported by the summer months with demand seen rising ahead of the US Independence day holiday. The gains in Crude oil were also seen as a strong driver in the US equity markets which continued to extend their gains for the second day. The Dow Jones closed 1.64% higher while the S&P500 inched 1.70% for the day.
Oil prices closed bearish last week, settling at $47.65 but remain supported above the key levels of $44.80 and $43.40.

Besides the inventory report, Oil markets continue to remain supported by supply disruptions. The latest to the list includes Norway’s oil and gas workers threatening to go on strike if a new wage deal isn’t agreed upon by July 1st. It is estimated that 13.72 million barrels could be cut off from the supply.
Crude Oil – Technical Outlook
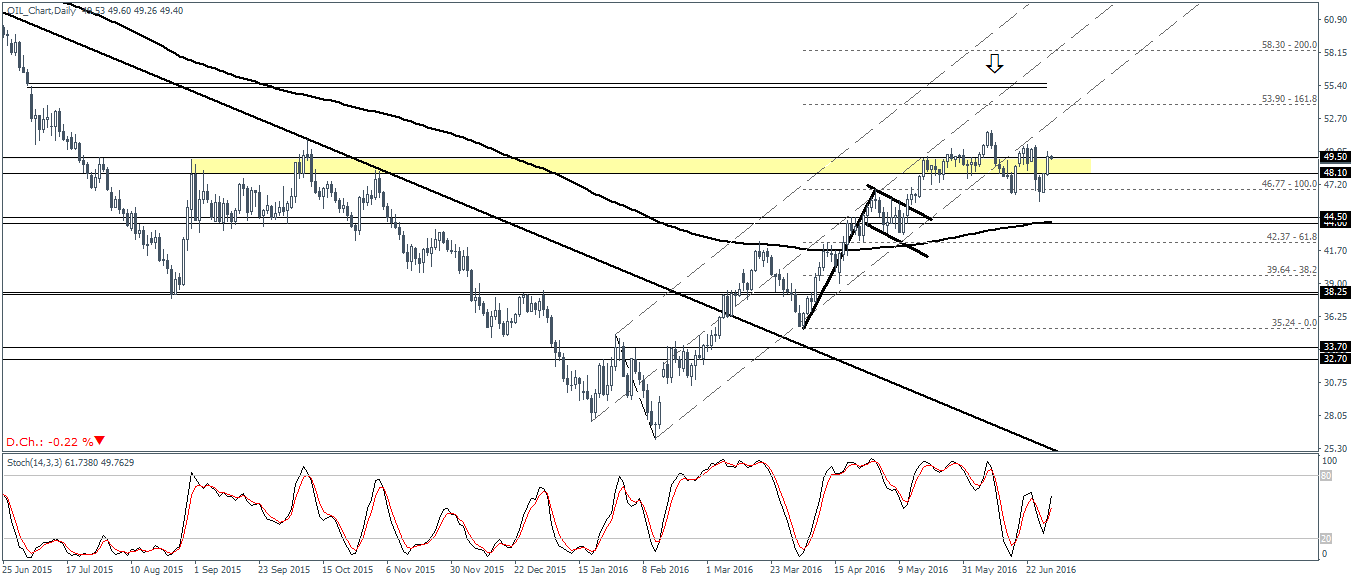
The current behavior of oil prices shows a strong alignment of both short-term fundamentals and the technicals. In last week’s report, we noted that Oil prices could turn bullish following the bullish flag pattern that was formed on the daily charts. While Oil prices briefly hovered above the $48.10 support level, prices eventually slipped lower to retest the highs of the bullish flag at $46.77. After two tests back to the support level, WTI Crude oil is back trading in the resistance zone of 49.50 – 48.10. Further upside is likely to be confirmed on a clean break above this resistance level in which case Oil prices could steadily rise towards the maintained target price level of 55.0 – 55.50.
The weekly chart for Crude oil shows prices remaining largely supported above the weekly support at 44.80 – 43.40. Any downside risks are likely to stall near this major support level and thus maintain the view that further upside to 55 is on the horizon. The Stochastics oscillator on the weekly chart is also currently above 80, and a renewed buy signal here could confirm the upside bias in Oil prices.
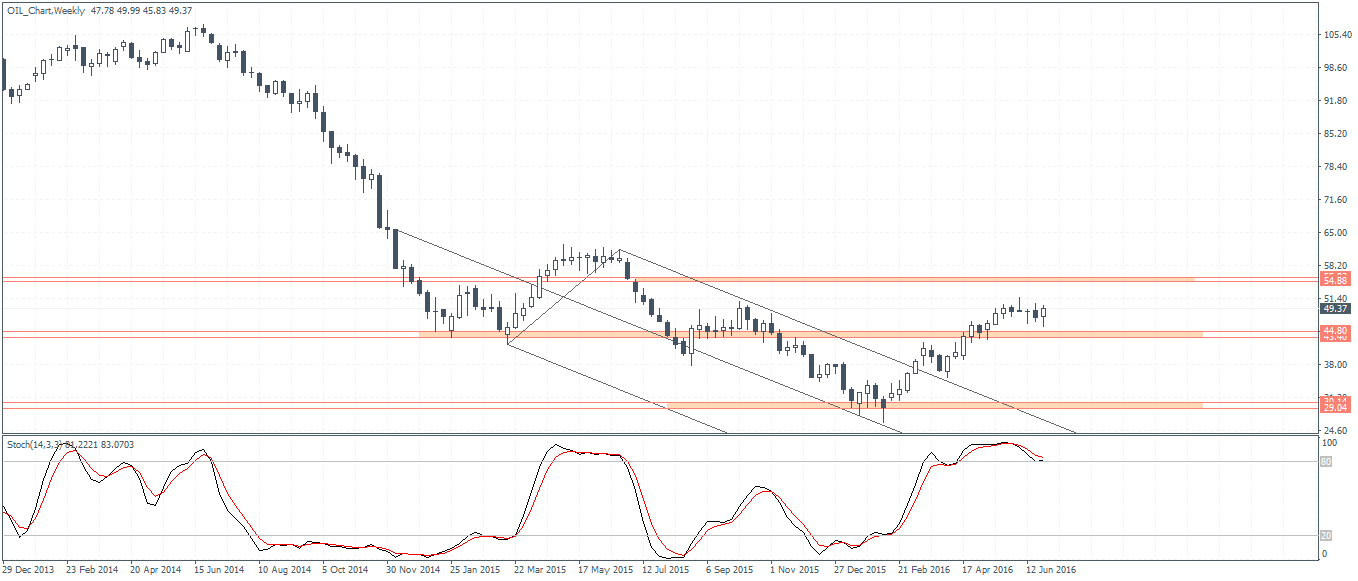
To conclude, Oil prices are likely to head higher in the near term with the target of 55.0 – 55.50. To the downside, declines could be limited to the weekly support at 44.80 – 44.50. A decline to these levels could, however, put to question the upside bias in Crude oil as the resistance at 49.50 – 48.10 could keep a lid on the gains. Look for oil prices to clear the resistance level where prices are trading currently to establish a gradual rally to the $55.0 mark

