
Gold prices are showing no signs of downside weakness this week with prices resuming the rally from where they left off last week. Gold is now inching closer to the coveted $1300 level and looks to be supported by a variety of factors; from monetary policy outlook to geopolitical risks. Today’s main risk event to watch out for will be the FOMC meeting. Analysts at large expect to see no changes to rate hikes following weak jobs report in May. However, yesterday’s retail sales numbers showed otherwise with consumer spending on the rise. The US import prices also cast an early glimmer of hope that US inflation could start to rise with oil prices rising again. Perhaps Janet Yellen was indeed right in calling the slump in oil prices ‘transitory’ although it took a bit too long.
Following today’s FOMC meeting, the Bank of Japan’s monetary policy meeting tomorrow will be the next event risk in terms policy changes. While the markets have priced in no change to the Fed funds rate today, the BoJ is likely to be a surprise event, especially with USDJPY trading near the 105 levels.
The gold bulls are back this week after disappearing when prices fell to $1200 levels just a few weeks ago. ANZ expects that the current landscape will be supportive of more gains in gold. ANZ commodity strategist Daniel Hynes says that “Risk aversion by the Brexit vote could be ‘a real watershed moment’ for precious metals, which could push gold to $1400. If the Leave campaign is successful, the expected collapse in the GBP and resultant market volatility would likely see investors seek safe haven assets.”
Georgette Boele, coordinator of foreign exchange and precious metals strategy at ABN Amro is also on the bullish side of gold noting that “In the days and weeks following the Brexit result, gold prices could rally to USD 1,350 per ounce.”

Gold – Technical Outlook
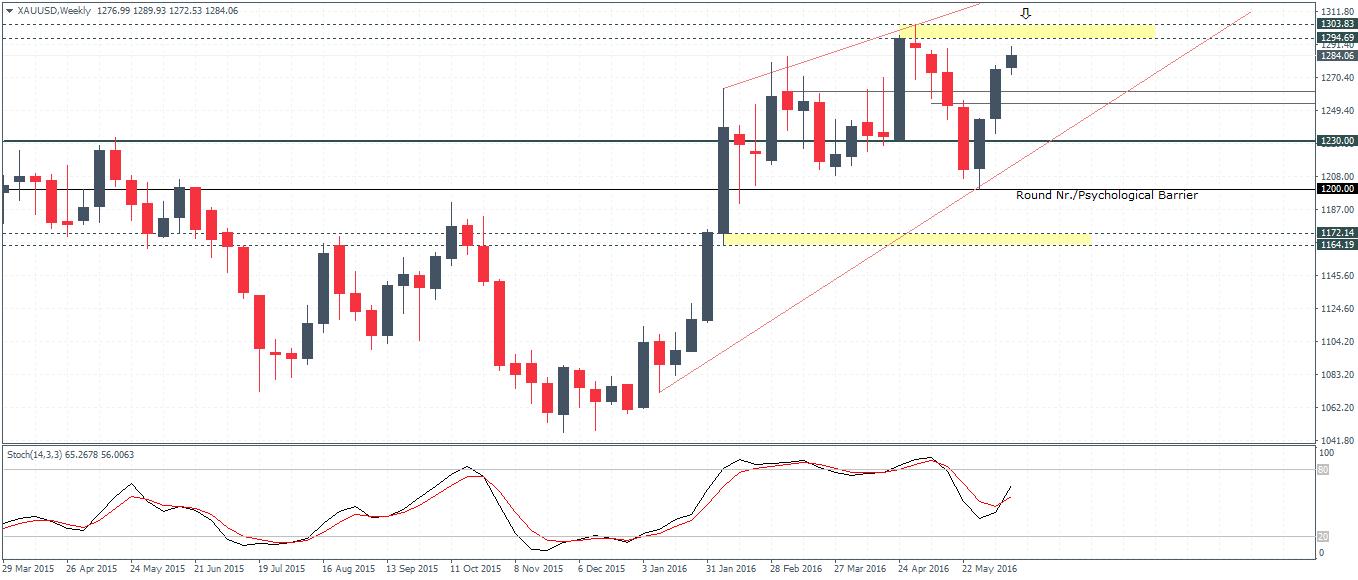
On the weekly chart, this week’s rally has invalidated the ascending wedge pattern following the previous dip to the $1200. While we expected further declines down to 1172 – 1164, price action has reversed back strongly breaking above the 1250 level. Gold prices are now just a few points away from April’s higher close near 1294.70 and this year’s all-time highs of 1303.83. A bullish break above this level and one that is convincing will see gold prices sustain further gains to the upside. However, failure to close at this level could see gold retreat lower, potentially to the 1230 levels, but limited above 1200. This week’s close will be therefore very important for gold prices, ahead of next week’s all-important UK referendum vote taking place. A lower high formed could see the bearish divergence on the weekly chart post a correction in prices, to the untested support at 1172 – 1180 region.
On the daily chart, gold prices are carving out a head and shoulders pattern, but it is starting to look increasingly doubtful especially with the current highs trading close to the previous highs near the head. However, as long as gold prices do not close above $1300, the pattern could remain in play. The neckline support is identified near 1208 – 1215, a break of which could see gold prices decline initially to 1180 – 1172 followed by 1112 – 1098 if prices continue to extend the declines.
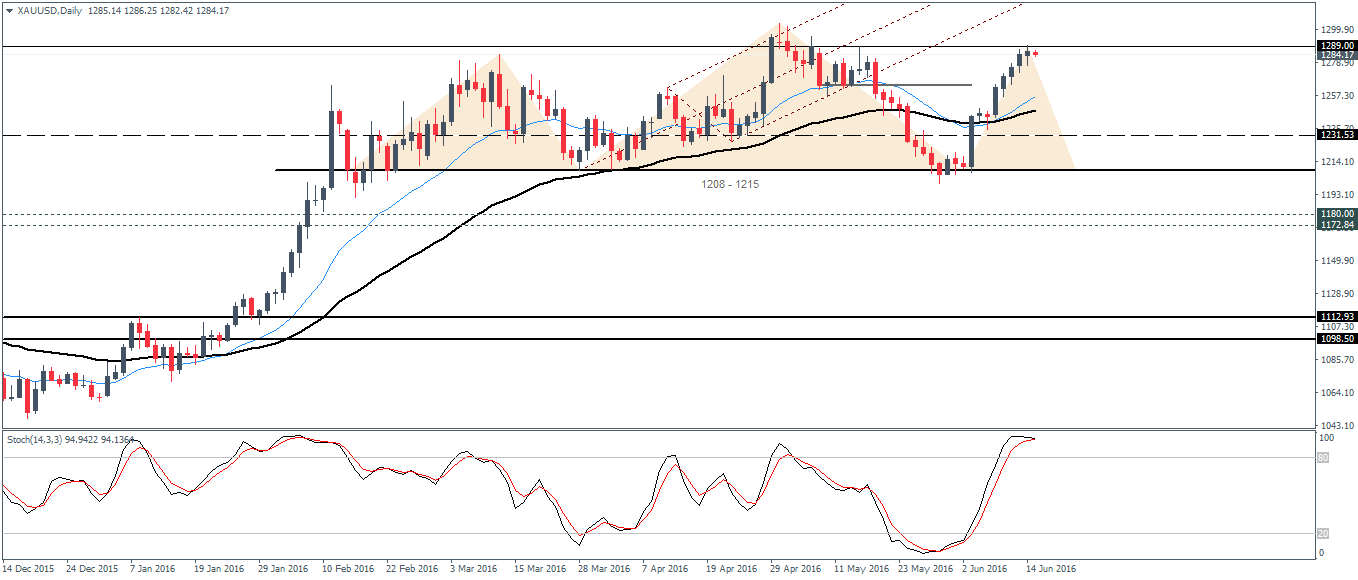
Putting it together, gold prices can see further gains only on a conclusive close above the $1300 level, but with no support being tested to the downside, there is scope for gold prices to decline lower towards 1220 – 1230 levels. With the daily chart forming a head and shoulders pattern, gold prices could extend their declines towards 1100 and lower if the neckline support at 1208 – 1215 gives way.

