14/06/2016
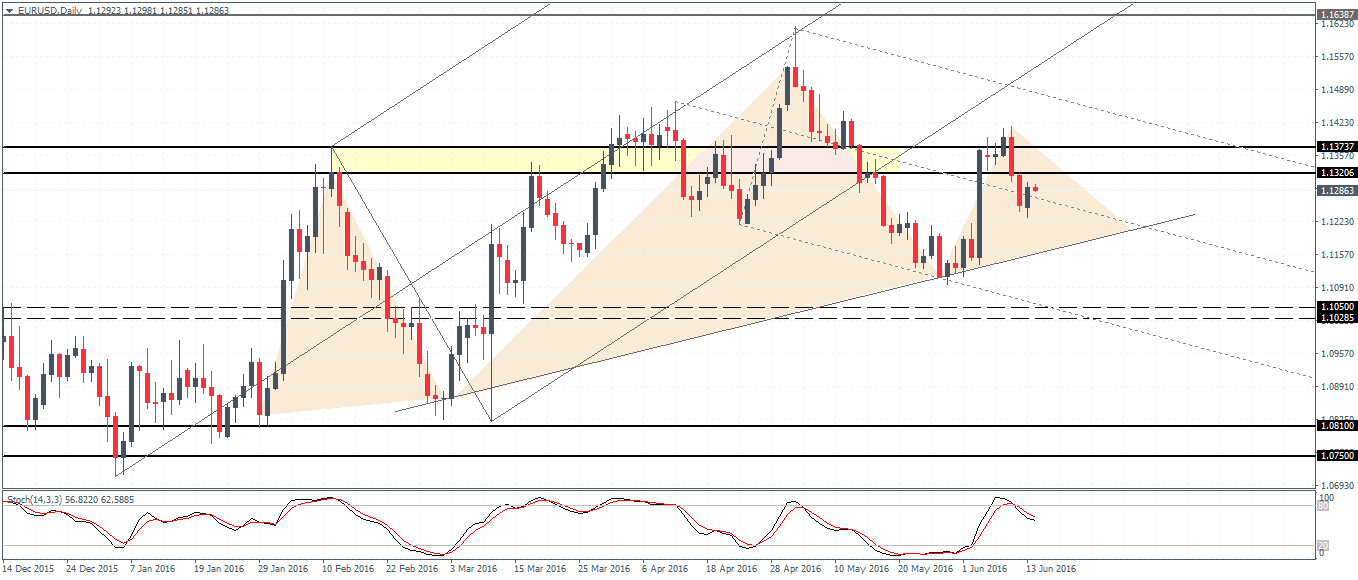
EURUSD (1.1286) fell for two straight days after price failed to break above the 1.1373 – 1.1320 resistance level. The inverse head and shoulders called out in last week’s analysis remains in play with price consolidation likely to continue into Wednesday’s FOMC meeting. However, with EURUSD closing bullish yesterday and forming a piercing line candlestick pattern, the bias may shift to the upside. A bullish pattern near 1.132 – 1.1373 could potentially threaten to take out the previous local high formed at 1.1415. That said, as long as the previous swing high near 1.153 – 1.160 is not tested, the bias remains to the downside with 1.1055 – 1.1028 likely to be tested.
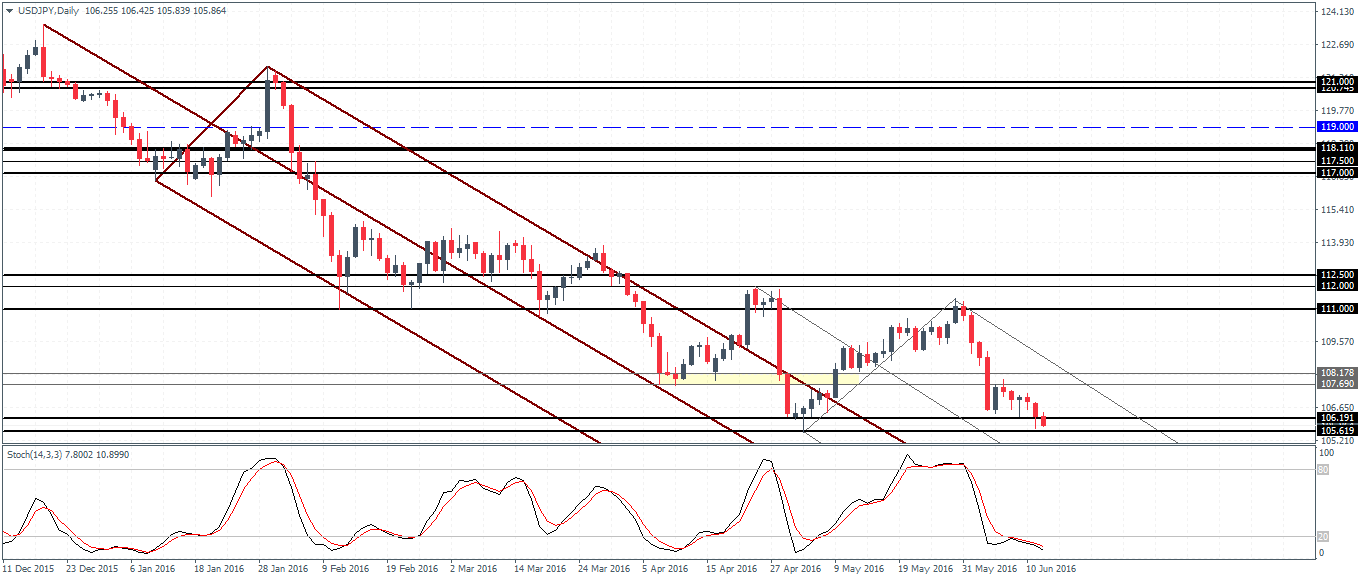
USDJPY (105.86) continues to remain weak in favor of the downside bias. However, price action is seen trading near the support level of 106.20 – 105.620. As long as this support holds, we could expect a near term bounce, but the upside remains capped near 108.18 – 107.70 resistance. Only a clean break above this resistance could see further upside in USDJPY. To the downside, below 105.620, the next support comes in at 105 and 104.50 levels.

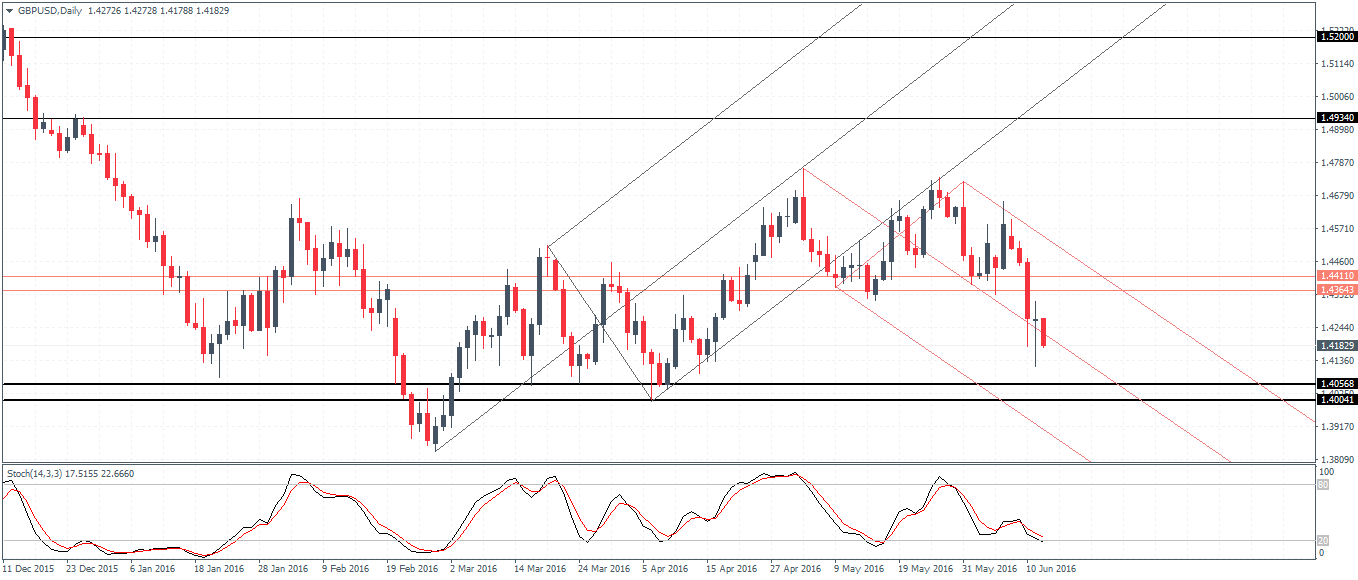
GBPUSD (1.4182)After failing the support at 1.4410 – 1.4436, GBPUSD has turned weaker and the current downside could see prices slide to 1.4056 – 1.400 support. The downside could extend its declines provided prices can close below yesterday’s doji low. In the mean time, GBPUSD could remain range bound within yesterday’s range. Upside is capped with the broken support now acting as resistance at 1.4411 – 1.4364 level.
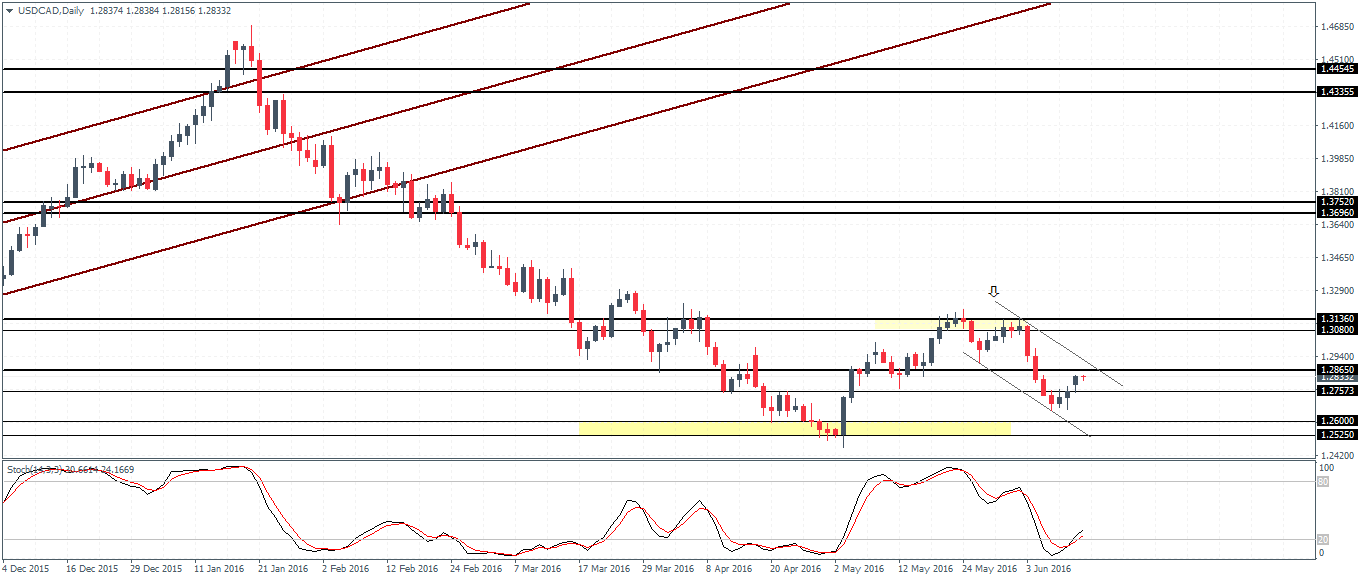
USDCAD (1.2833) has been reversing off the 1.265 – 1.270 levels. The potential cup and handle pattern remains in play but will be validated only on a close above 1.2865 resistance. However, USDCAD is still not out of the woods unless we see a close above the support at 1.3136 – 1.308 resistance, which is currently a strong level as seen on the chart. In the near term, USDCAD could remain range bound as a result. To the downside, 1.260 – 1.2525 support is likely to limit the declines.
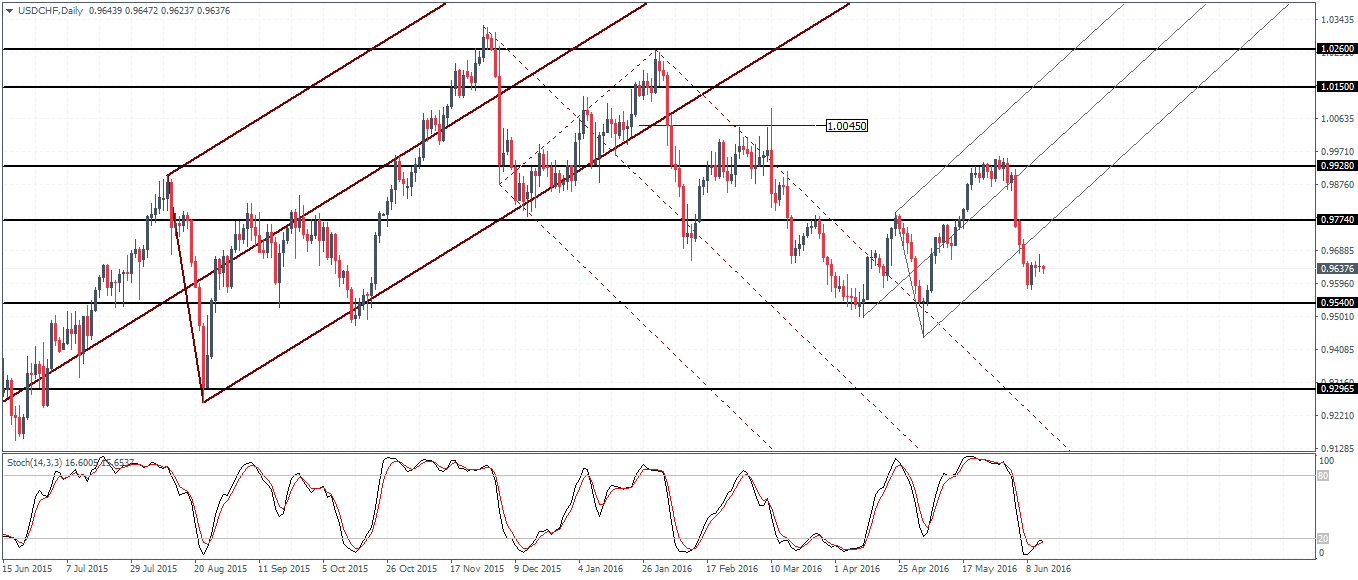
USDCHF () has broken out from the median line but price action is seen consolidating at the current levels. To the upside, a retest to 0.97740 cannot be ruled out, but further upside remains limited unless USDCHF breaks out strongly above the identified resistance level of 0.97740. With the hidden bearish divergence formed with price making a lower high near 0.9928, the downside is likely to be completed on a test to 0.9540 level.