
Gold prices may be slipped strongly in May, posting the first monthly decline in prices this year. While the correction in gold prices might keep the upside limited, a further decline in prices over the next few weeks or at least until the geopolitical and central bank uncertainty calms over the next two weeks.
The Federal Reserve is expected to meet on June 15th and to go by Fed Chair Janet Yellen’s speech earlier this week; a rate hike seems unlikely. However, the tone of the statement will be crucial for the forward guidance. The markets still expect to see July meeting as the next potential opportunity for the Fed to hike rates. The Bank of Japan will also be meeting a few hours later, and the markets remain in a guessing mode adding to the uncertainty. Regardless of the short-term swings in gold prices, the June 23rd referendum in the UK regarding its EU membership will no doubt keep gold prices in a sideways range with limited downside.
Last week’s Commitment of Traders report from the CFTC showed that money managers continued to cut their long exposure on gold, and interesting have been adding to the Dow futures. The shift of focus to the equities side supports the view that investors are comfortable taking on more risk.
There is also a clear indication that the hitherto crowded position in gold is starting to ease back. It was only a few weeks ago when gold was trading above the 1280 levels that many were expecting to see more upside in gold. With the recent shakedown of weak long positions, gold prices are likely to remain consolidated.

Last week, Gold prices surged following a surprisingly weak jobs report. Comex gold futures surged 2.85% on Friday after the NFP report and remained flat this week. Monday’s Janet Yellen’s speech did help the case either with the precious metal likely to wait for more fundamental catalysts
Gold – Technical Outlook
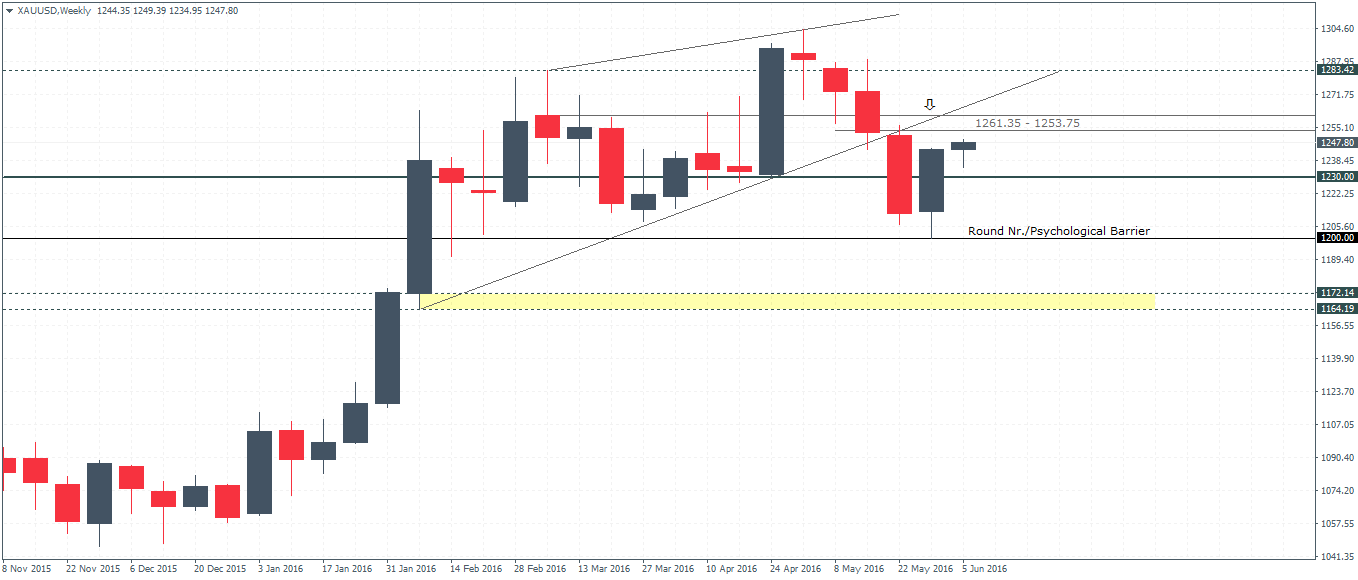
Starting with the weekly chart, Gold prices fell to 8-week lows of 1206.90 two weeks ago before settling at 1212.19. This breakdown in prices came after gold broke the minor trend line. However, prices quickly regained most of the losses last week closing back at 1243.92 after a brief test to the $1200 psychological level. The weekly chart’s rising wedge pattern continues to remain in play, and further upside remains for a test towards 1261.35 – 1253.75 which marks the breakout level. Retesting this price level could mean a breakdown towards 1200, with the big question being whether the psychological level could hold the declines on a second test to the support.
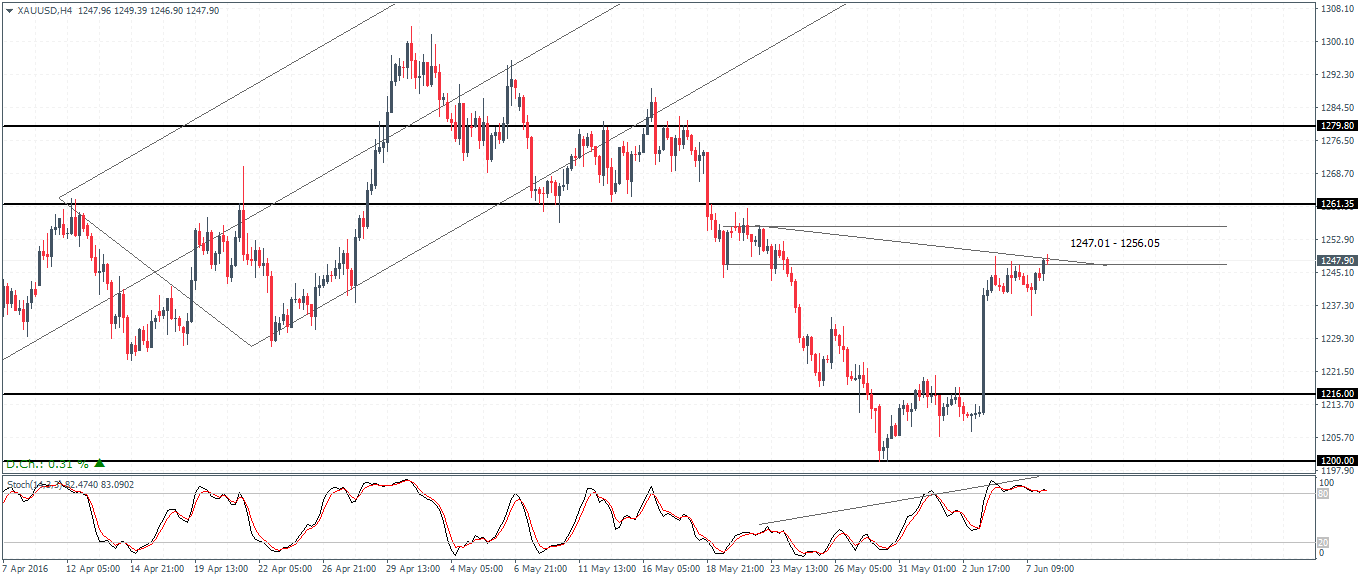
On the daily chart, following the bounce off the 1200 level, gold prices are poised for further upside with the main resistance at 1261.35 – 1279 likely to cap further gains in prices. However, the retracement to the upside is likely to be validated if prices pull back lower to test the support levels above 1216. On the 4-hour chart, the hidden bearish divergence is quite evident with the lower high gold prices being reflected by higher highs in the Stochastics. Indicating a weakness in the upside momentum, expect gold to pull back towards the 1216 – 1219 region on the short term charts.
Putting it together, gold prices could see a correction to the 126 – 1219 level to establish support ahead of further upside towards 1261 – 1253 region. A push higher could mean that gold might test the 1270 region as well, but the upside is likely to remain flat above this level.

