
EURUSD (1.153)
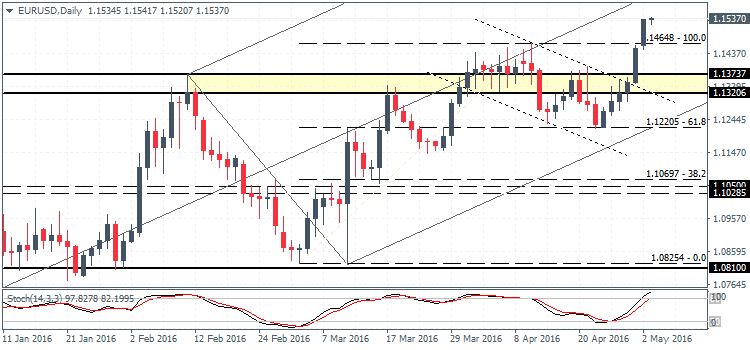
- EURUSD invalidated the head and shoulders pattern and moved higher on a strong bullish momentum
- Price broke above September 2015 highs and now targets 1.160 having cleared 1.1480
- Failure to close on a higher close could see the bearish divergence point to a strong correction towards 1.105 – 1.10285
- However, price will need to break below 1.1373 – 1.1320 support ahead of further declines
- Alternately, the bullish flag pattern that has formed could see further upside to 1.1638 followed by 1.186
- Support: 1.1373 – 1.132; Resistance: 1.1638 – 1.165
USDJPY (105.9)

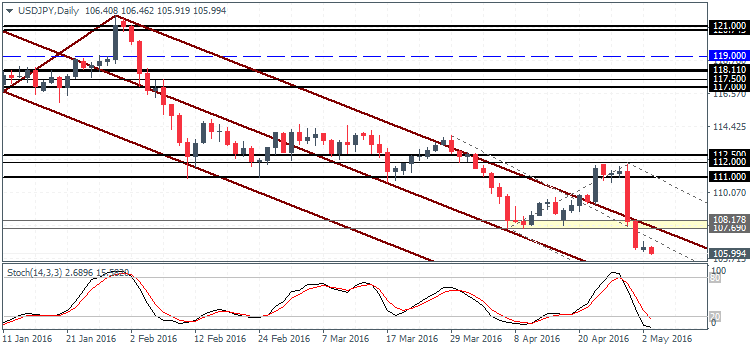
- USDJPY has broken below the 108.17 – 107.69 support and continues to break lower
- Stochastics currently show a higher low taking shape, but needs to be confirmed on a daily close
- A bullish divergence here could spell a near-term correction which could be validated if USDJPY clears the previous support at 108.17 – 107.69 which could act as resistance
- Above 108.17 – 107.69, the next main resistance comes in at 111.0
- Downside continuation could see 105.30 coming in as the next level of support
- Support: 105.30; Resistance: 108.17 – 107.69
GBPUSD (1.4677)
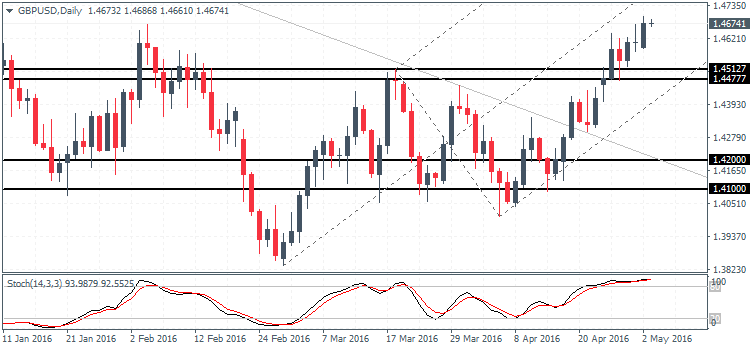
- GBPUSD is looking to continue its bullish moment with prices closing bullish above the doji high from the previous session
- Downside is well supported by the recently broken resistance at 1.4512 – 1.4477, which could act as a strong support in the near term
- The inverse head and shoulders pattern points to a continuation to the upside with 1.4934 as the initial level of resistance that could be tested followed by 1.52
- Support: 1.4512 – 1.4477; Resistance: 1.4934
USDCAD (1.2527)
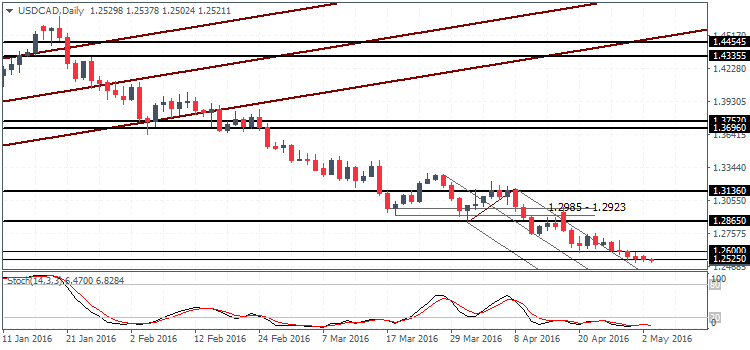
- USDCAD continues to push lower having broken below 1.26
- Support is seen near 1.26 – 1.2525, which could see further downside with the next main support coming in at 1.1955
- Resistance is seen near 1.2865 – 1.2923 which could potentially cap any upside gains
- Above 1.2923, the next main resistance is seen near 1.31360, but it is unlikely for USDCAD to break higher unless support at the current levels holds prices strongly
- Support: 1.26 – 1.2525; Resistance 1.2865 – 1.2923
USDCHF (0.954)
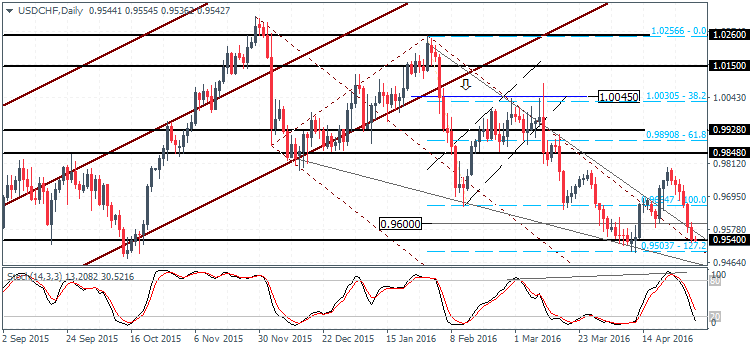
- USDCHF is back to the support level near 0.954, which was latest tested in early April this year
- If the support holds, USDCHF could see potential upside to 0.9848, marking a retest of the previously broken support level for resistance
- A break below 0.954 could see prices slip to 0.95, but a break below this level could see further downside extending towards 0.93
- Stochastics is currently forming a bullish divergence but needs to be confirmed with price action closing above 0.96
- Support: 0.954 – 0.95; Resistance: 0.9848 – 0.9928

