Image via John Sonderman / Flickr
It is the big Friday as the markets eagerly wait for the NY session to kick off. On the tap is the second revision to the US GDP for the first quarter. Economists point to a revised print of 0.90%, higher than the initial estimates of 0.50%. However, the GDP data is for the first quarter and any reaction to the data is going to be short lived as the markets shift attention to Q2 data instead. So far economic data across the board, housing, inflation, consumer spending all point to an improved second quarter GDP data.
Fed Chairwoman Janet Yellen will be speaking later this evening and her remarks could see the markets turn volatile. In light of the April minutes and the recent hawkish Fed rhetoric where various Fed members caution on a rate hike in June (or July), the Dollar Index has risen in anticipation of the Fed’s rate hike, while sending gold prices weaker. Yellen’s speech could be hawkish given the recent string of positive economic data from the US. But some expect that Yellen could in fact remain dovish. DoubleLine honcho Jeffrey Gundlach says he’s expecting Yellen will be “dovish” when she speaks but there’s up to a 75% chance that the Fed will raise rates this year — which would weaken the dollar.
Most recently, Fed voting member Jerome Powell, in a prepared remarks said “Depending on incoming data and the evolving risks, another rate increase may be appropriate fairly soon.” Another voting member, James Bullard sounded a bit more guarded in his speech noting that “stronger labor market favors slow normalization but markets expect almost no normalization.”

US Dollar Technical Outlook
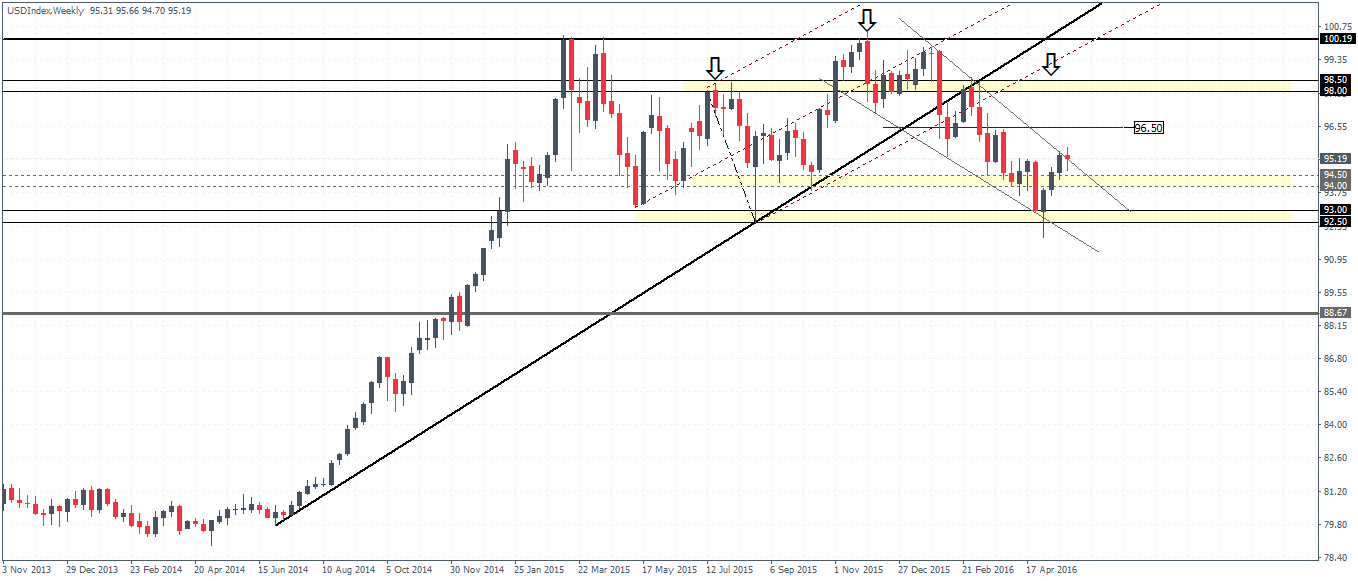
The weekly chart for the US dollar index shows prices staying flat for the most part this week after staging a strong three week rally since early May. With 94.50 – 94.0 price level being cleared, any downside is limited in the near term.
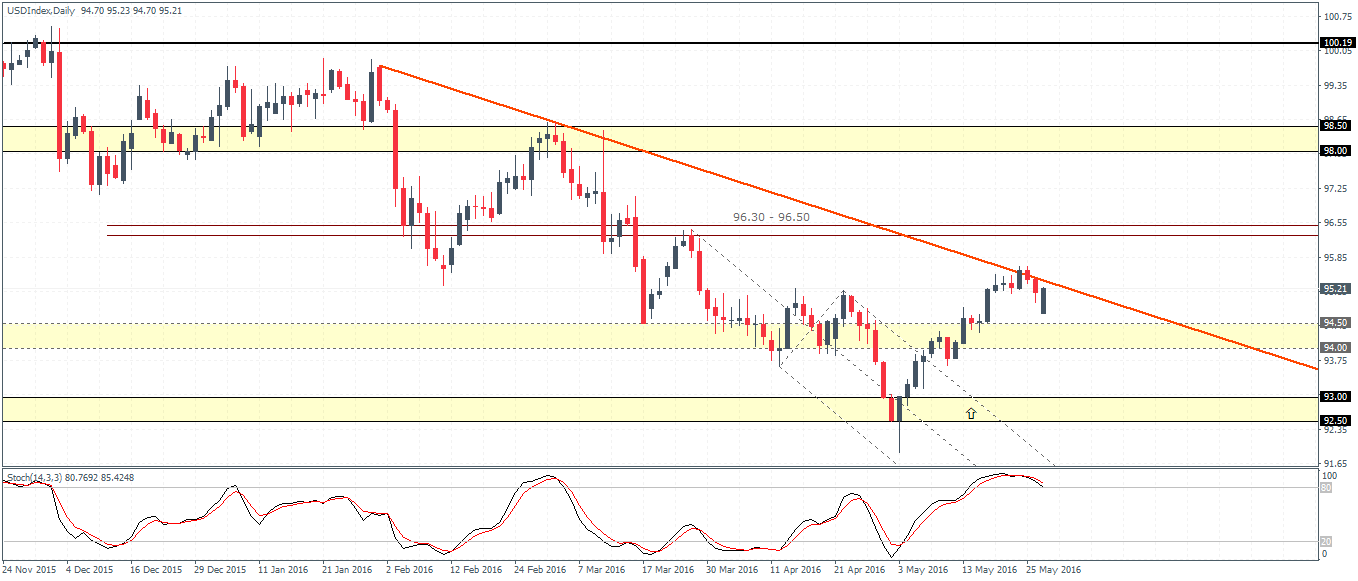
On the daily chart, the US dollar index opened today on a bullish note, initially gapping lower to open at 94.70 but has failed to test the support at 94.50 – 94.0. To the upside 96.30 – 96.50, resistance remains a key level to watch for. Price action has tested the falling trend line connecting the highs of February 1st and 2nd of March, which is another factor to consider. Only a daily break above this level with a bullish pattern follow through will confirm further upside to the next resistance at 96.30 – 96.50.
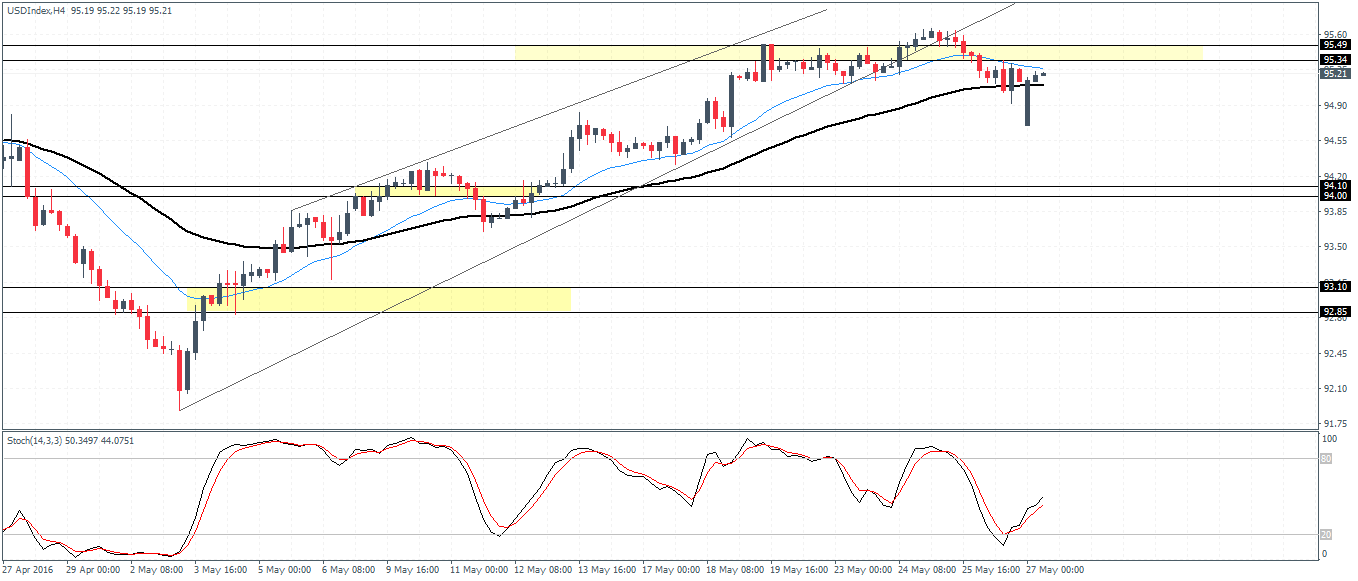
Finally, the 4-hour chart on the US Dollar index shows the minor 4-hour resistance at 95.50 – 95.35 level being key for further upside. Failure to break above this level on the 4-hour time frame could confirm the downside move for a test to 94.10 – 94.0 region in the near term, validating the daily and weekly view that the dollar index will be pushing lower to establish support ahead of a move to the upside.